Try it on your own data
Every report in this article is in the free plan. One snippet for web and apps, up to 10 sites.
Start freeTo lower customer acquisition cost, change one of three terms in CAC = cost per click ÷ visit-to-customer rate: raise the conversion rate, lower the click cost, or move budget to channels where the next customer costs less. On a sample $50,000 month, each lever takes paid CAC from $200 to between $166.67 and $178.57, and all three together reach $125. The page shows the math, the marginal-CAC rule and a guard against hurting lifetime value.
What you will learn
- CAC = cost per click ÷ visit-to-customer rate, so only conversion, click cost and channel mix can lower it
- Move budget by marginal CAC, the cost of the last increment, not by average CAC; test in 20 to 30% steps
- After each lever check lifetime value and payback so cheaper customers are not worse customers
What are you lowering: paid CAC or fully loaded CAC?
Customer acquisition cost (CAC) is the money spent to win customers in a period divided by the new customers won in that period. Before choosing levers, fix which version you are measuring, because the three levers below move both but by different amounts.
- Paid CAC = advertising spend ÷ new customers. Quick to compute, and it is what ad platforms and a channel report can show.
- Fully loaded CAC = (advertising + sales and marketing salaries, tools, agencies and other overhead) ÷ new customers. This is the figure that has to be paid back by customer value. The full method, with edge cases, is in how to calculate CAC, and the definition is in the CAC glossary entry.
The worked example uses both. Sample data: a store spends $50,000 a month on paid media and another $10,000 on tools, contractors and a share of salaries. Paid CAC is the headline; fully loaded CAC is shown beside it so you can see the lever still works when overhead is included.
The three numbers behind every CAC
For paid acquisition, CAC splits into two things you can act on:
CAC = cost per click ÷ visit-to-customer rate
A $2.50 click that converts 1.25% of the time costs $2.50 ÷ 0.0125 = $200 per customer. So there are only three ways to lower it:
- Raise the visit-to-customer rate, so each click is worth more.
- Lower the cost per click, so each visit is cheaper.
- Change the mix, so budget moves from channels where a customer costs a lot to ones where it costs less.
Everything else on the usual "ways to cut CAC" lists, such as referral programs, email, content and pricing tests, is a way of doing one of those three things, or of acquiring customers outside the paid denominator. That is why a single worked example can compare the levers fairly.
The baseline month
Sample data, recomputed for this article:
| Item | Value |
|---|---|
| Paid media spend | $50,000 |
| Average cost per click | $2.50 |
| Clicks | 50,000 ÷ 2.50 = 20,000 |
| Visit-to-customer rate | 1.25% |
| New customers | 20,000 × 1.25% = 250 |
| Paid CAC | 50,000 ÷ 250 = $200 |
| Fully loaded CAC | (50,000 + 10,000) ÷ 250 = $240 |
The spend is split across three channels. Their average CACs are what the mix lever works on:
| Channel | Spend | Customers | CAC |
|---|---|---|---|
| A | $20,000 | 150 | $133.33 |
| B | $20,000 | 80 | $250.00 |
| C | $10,000 | 20 | $500.00 |
| Scenario | Customers | Paid CAC | Fully loaded CAC |
|---|---|---|---|
| Baseline | 250 | $200.00 | $240.00 |
| Conversion 1.25% to 1.5% | 300 | $166.67 | $200.00 |
| Cost per click $2.50 to $2.10 | 297.6 | $168.00 | $201.60 |
| Move $10,000 from C to A | 280 | $178.57 | $214.29 |
| All three together | 400 | $125.00 | $150.00 |
Sample data: $50,000 paid media plus $10,000 other cost; assumptions stated in the article.
Lever 1: raise the visit-to-customer rate
A customer who does not convert after you paid for the click is the most expensive kind. Lifting the rate from 1.25% to 1.5% (a 20% improvement) gives 20,000 × 1.5% = 300 customers for the same $50,000, so paid CAC falls to 50,000 ÷ 300 = $166.67 and fully loaded CAC to 60,000 ÷ 300 = $200.
How much improvement is realistic depends on where you leak. The Baymard Institute, which aggregates studies of online checkouts, puts the average documented cart abandonment rate at 70.22% across 50 studies and estimates that better checkout design could raise conversion by 35.26% for the average large ecommerce site. That is an ecommerce estimate, not a promise for your site, but it shows 20% is a modest target when checkout friction is the problem.
To find yours, work down a short list in this order:
- Funnel step with the biggest drop. Count how many people reach each step from landing page to purchase and fix the step with the largest relative loss, not the one that looks ugliest.
- Ad-to-page match. If the headline and offer on the landing page differ from the ad, people leave. Segment landing-page conversion by campaign to find the mismatches.
- Checkout friction. Forced account creation, surprise costs and few payment options are common causes of abandonment.
- Speed on mobile. Compare conversion by device before spending on anything else.
Lever 2: lower the cost per click
Google states that higher-quality ads can often lead to lower costs per click, and lists ad and landing page quality among the things it assesses. Quality Score, the 1 to 10 diagnostic at keyword level, is built from expected click-through rate, ad relevance and landing page experience, but Google also says it is not an input in the ad auction. Treat it as a pointer to what to fix, not a dial.
Suppose better matching of ads to search terms and a faster landing page cut the average cost per click from $2.50 to $2.10 (16% lower; sample assumption). The $50,000 buys 50,000 ÷ 2.10 = 23,809.5 clicks, which at 1.25% is 297.6 customers. Paid CAC becomes 50,000 ÷ 297.6 = $168.00, fully loaded $201.60.
Where to look first:
- Search terms that waste clicks. Terms with clicks and no relevance push the average up. Exclude them (the analysis is covered in PPC analysis).
- Ads that earn few clicks. A low click-through rate usually means the ad does not match the search.
- Landing page experience. The same page change often helps lever 1 as well, so measure both.
Lever 3: shift budget by marginal CAC, not average CAC
Channel C costs $500 per customer on average, against $133.33 for channel A. The obvious move is to cut C and put the $10,000 into A. The part people skip: the next dollar in A will not buy customers at A's average CAC. Audiences saturate, so the marginal CAC is higher than the average one.
Suppose the extra $10,000 in channel A returns customers at $200 each (1.5 times its average; a sample assumption). Then:
- Channel C loses 20 customers.
- Channel A gains 10,000 ÷ 200 = 50 customers.
- Total customers: 150 + 50 + 80 = 280, up from 250.
- Paid CAC: 50,000 ÷ 280 = $178.57; fully loaded: 60,000 ÷ 280 = $214.29.
The rule: move budget from the channel with the highest marginal CAC to the one with the lowest, and test with a step, not a leap. Increase the better channel by 20 to 30% for two weeks and recompute its CAC on the added spend before moving more. Marginal CAC is what the last increment cost: (new spend − old spend) ÷ (new customers − old customers).
Channel-level CAC also depends on how credit is assigned. If a channel mostly assists, last-click credit will understate its worth, so check it against a view that shows assists before cutting it. See multi-touch attribution.
What the three levers add up to
The levers compound because they multiply: a better conversion rate, a lower click cost and a better mix each change a different term.
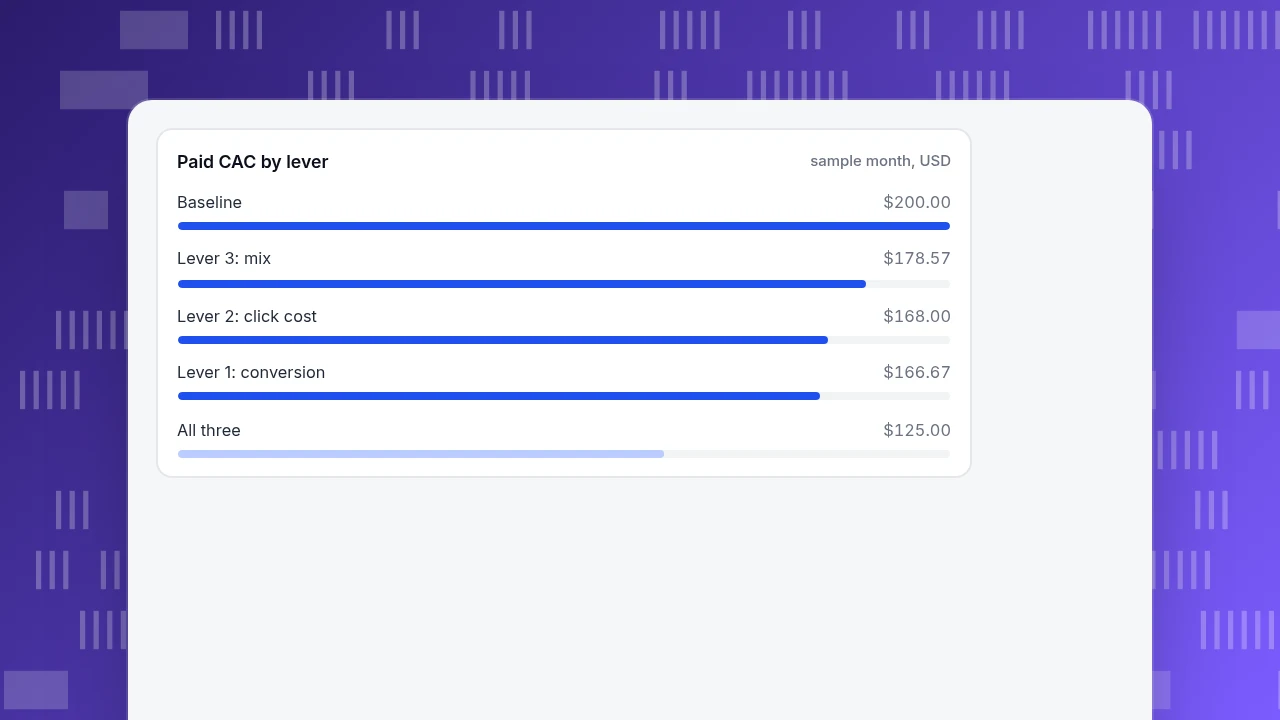
| Scenario | Customers | Paid CAC | Fully loaded CAC |
|---|---|---|---|
| Baseline | 250 | $200.00 | $240.00 |
| Lever 1: conversion 1.25% to 1.5% | 300 | $166.67 | $200.00 |
| Lever 2: cost per click $2.50 to $2.10 | 297.6 | $168.00 | $201.60 |
| Lever 3: move $10,000 from C to A | 280 | $178.57 | $214.29 |
| All three together | 400 | $125.00 | $150.00 |
Levers 1 and 2 together give 50,000 ÷ 2.10 × 1.5% = 357.1 customers, a CAC of $140. Every channel's CAC then falls to 70% of its old value ($140 ÷ $200). Channel A's original $20,000 buys 214.3 customers and channel B's $20,000 buys 114.3. Channel C's $10,000 moved to A at the new marginal $140 buys 71.4. The total is 400 customers. These are sample numbers with stated assumptions, so use them as a template for your own table rather than as targets.
Paid CAC by lever
sample month, USDWhen lowering CAC backfires
CAC alone is half a ratio. Cutting it by dropping to the cheapest customers can lower lifetime value by more. Harvard Business Review reports that acquiring a customer can cost anywhere from five to 25 times more than retaining one, and cites Bain's Frederick Reichheld on a 5% rise in retention raising profits by 25% to 95%. That does not make acquisition spending wrong. It means the check after every lever is the ratio of lifetime value to CAC and how long CAC takes to pay back; see LTV to CAC ratio.
Two guard rules:
- Do not accept a lower CAC that comes with a lower first-month retention. Compare the cohort you acquired after the change.
- Do not count customers who would have come anyway. Branded searches and returning customers make a channel look cheap. Report CAC for new customers only.
Where TapCub fits
Use the same store to run the three levers with TapCub as the measuring tool. TapCub does not buy ads or change bids; it shows what happened after the click.
- Put spend next to results. In All-platform analytics › Business › Channel ROI, import spend on the Costs tab (CSV with day, channel, source, campaign and cost) or add rows one by one. The ROI tab then shows cost per click (spend ÷ sessions), cost per acquisition (spend ÷ purchases on the order ledger) and return on ad spend, grouped by channel, source or campaign. Note that cost per acquisition here counts purchases, so it is a paid CAC; add your overhead yourself to get the fully loaded figure.
- Find the leak for lever 1. In Web analytics › Goals and the funnel in All-platform analytics › Behavior › Behavior analysis, find the step with the largest drop and compare by source.
- Check the mix for lever 3. Use the same Behavior analysis page with several attribution models selected, such as last touch, first touch and linear, side by side. A channel with credit under first touch but little under last touch is mostly an assist.
- Re-check after each change. Add a date mark in Configuration › Annotations when you move budget, then compare CAC by channel for the weeks before and after.
Sessions are not clicks, and an ad platform's click count will differ from TapCub's session count; keep each CAC calculation inside one source of truth.
FAQ
How do you lower customer acquisition cost?
Change one of three terms: raise the visit-to-customer rate, lower the cost per click, or move budget from channels with a high marginal cost per customer to ones with a lower one. Calculate CAC before and after each change and check that lifetime value did not fall.
What is a good CAC?
It depends on what a customer is worth. A common test is the ratio of lifetime value to CAC, plus the months it takes to earn CAC back from gross margin. There is no single good figure that holds across businesses, so judge it against your own margin and retention.
Is it better to cut the channel with the highest CAC?
Not automatically. Average CAC hides assists and saturation. Check whether the channel mostly assists other channels, and estimate the marginal CAC of the channel you would move money to before cutting.
How long before a CAC change is visible?
Allow at least one full buying cycle, since customers who click today may buy next week. For fast-converting stores that is about two weeks; for longer sales cycles it is the length of the cycle. Judge a change by customers acquired after it, not by clicks.
Does reducing CAC reduce marketing quality?
It can if the cheaper customers are worse. Compare retention and revenue per customer for the cohorts acquired before and after each change, and keep CAC in step with lifetime value.
Sources
- Baymard Institute. Cart abandonment rate statistics — average documented abandonment of 70.22% across 50 studies, and the estimated 35.26% conversion gain from better checkout design. Checked 2026-11-20.
- Google Ads Help. About Ad Rank — ad and landing page quality as inputs, and higher-quality ads often leading to lower CPCs. Checked 2026-11-20.
- Google Ads Help. About Quality Score — 1 to 10 keyword-level diagnostic, its three components, and that it is not an auction input. Checked 2026-11-20.
- Amy Gallo, Harvard Business Review. The Value of Keeping the Right Customers — acquiring is five to 25 times costlier than retaining; a 5% retention gain raising profits 25% to 95% (Reichheld, Bain). Checked 2026-11-20.
Was this article helpful?
We use your answers to fix and expand this page.
Couldn’t send. Please try again in a minute.
Thanks for the feedback. We’ll use it to improve this page.You’ve already sent feedback on this page. Thanks.

Product Analyst
Focuses on event analysis, conversion funnels, and retention, using clear metric definitions and structured analysis to explain product performance.