Try it on your own data
Every report in this article is in the free plan. One snippet for web and apps, up to 10 sites.
Start freeA low bounce rate is good news only if nothing can make sessions look engaged when they are not. If it dropped overnight without a page change, suspect a tag firing twice, an event firing on page load or a single-page app reporting its first page twice. Compare bounce with pages per session on the date it changed: a double tag moves both.
What you will learn
- Check the tool's definition first: it decides whether a second pageview or an event turns a bounce into a non-bounce
- A double tag collapses bounce and doubles pages per session (62.0% to 0%, 1.95 to 3.90 in the sample); an on-load event moves only bounce
- Count tracking requests for one page load: expect one; if bounce is 25 points below its 8-week average, fix before you report
Is a low bounce rate good news or a tracking bug?
It is good news only if nothing in your setup can make sessions look engaged when they are not. A bounce rate that falls from 60% to 5% overnight, without any change to the pages, is almost always a measurement change: a tag firing twice, an event firing on page load, or a single-page app reporting its first page twice. A bounce rate that drifts down slowly after you improved a page is more likely real.
This guide gives you a way to tell them apart in about 15 minutes: a table of causes with the signature each leaves in your data and the test that confirms it, a worked example with numbers, and a decision rule. For what counts as a good number in the first place, see what is a good bounce rate; for lowering a high one, see how to reduce bounce rate; for the arithmetic, see how bounce rate is calculated.
What counts as a bounce, and does it depend on the tool?
Yes, it depends on the tool, so check the definition before you compare numbers. Two common definitions:
| Tool definition | A session is a bounce when… | Source |
|---|---|---|
| Google Analytics 4 | It was not engaged: it lasted 10 seconds or less, had no key event and had fewer than 2 page or screen views | Google Analytics Help |
| TapCub | It has one pageview and no custom event (an event whose name does not start with a double underscore) | TapCub docs, web metric definitions |
The same visit can be a bounce under one definition and not under the other. A visitor who reads one article for two minutes bounces under a "one pageview, no event" rule, but is engaged under GA4's 10-second rule. This matters for diagnosis: under "one pageview and no custom event", anything that adds a second pageview or a custom event to a one-page visit turns a bounce into a non-bounce, and these are the most common bugs. Under GA4's rule, a second page view or a key event does the same.
Which causes make a bounce rate look too low?
Start with the table. Each row gives what the data looks like, how to test it and the fix.
| Cause | What the data looks like | How to test | Fix |
|---|---|---|---|
| The tag is installed twice (theme plus plugin, or tag manager plus hard-coded) | Bounce near 0 on every page; pageviews per session about double what you expect | Count tracking requests in the browser's network panel for one page load; expect 1 | Remove the second copy |
| The tag fires twice on one template | Low bounce only for pages using one template or landing page group | Compare bounce by page; load the odd page and count requests | Fix that template |
| A single-page app reports its first page twice | Landing pages bounce less than in-app pages; two pageviews seconds apart | Load a landing page directly and count requests; compare with navigation inside the app | Turn off one of the two page-change triggers |
| A custom event fires on page load | Event count about equal to pageviews; bounce near 0 but very short visits | Open the events list and look for an event with a count close to pageviews | Fire the event on a real action instead of on load |
| A page reloads itself or a widget refreshes the URL | Large pageview counts on dashboard or live pages; unusually many pages per session | Watch one session's pageviews in the live feed for a minute | Stop the auto-reload or exclude the page |
| Redirects count on both sides (http then https, or www then non-www) | Landing pages show an extra pageview from your own domain | Load the old URL and count requests | Fix the redirect, or track only the final page |
| Internal and test traffic dominates | Low volume; the same few devices browse many pages | Look at sessions per device; exclude team visits | Filter internal traffic |
| Real engagement | Bounce falls slowly after a page change; duration and pages per session rise together | Compare before and after for the pages you changed | Nothing to fix; confirm with conversions |
Google's own guidance on a related problem shows how common this is: leftover duplicate tags cause "duplicate tracking" and "inaccurate data", and it recommends Tag Assistant to check which tags fire (Google Analytics Help). For single-page apps, Google warns that if you configure tags with Google Tag Manager you should not also enable automatic history tracking in Google Analytics, because that can lead to double-counting page views (Google for Developers).
| Test | What it tells you | Expect |
|---|---|---|
| Date of the drop | Whether a release or tag change caused it | One day, matching a deploy |
| Pages per session on that date | Duplicate tag if it rises with the fall in bounce | Little change |
| Requests per page load | Double tag | 1 |
| Event counts vs pageviews | Event on page load | No event close to pageviews |
| Bounce by page | Template problem | A spread, not 0% on some and 60% on others |
| Sessions per device | Internal traffic | No small group dominating |
Run in this order and stop at the first one that finds a problem.
What does it look like in numbers?
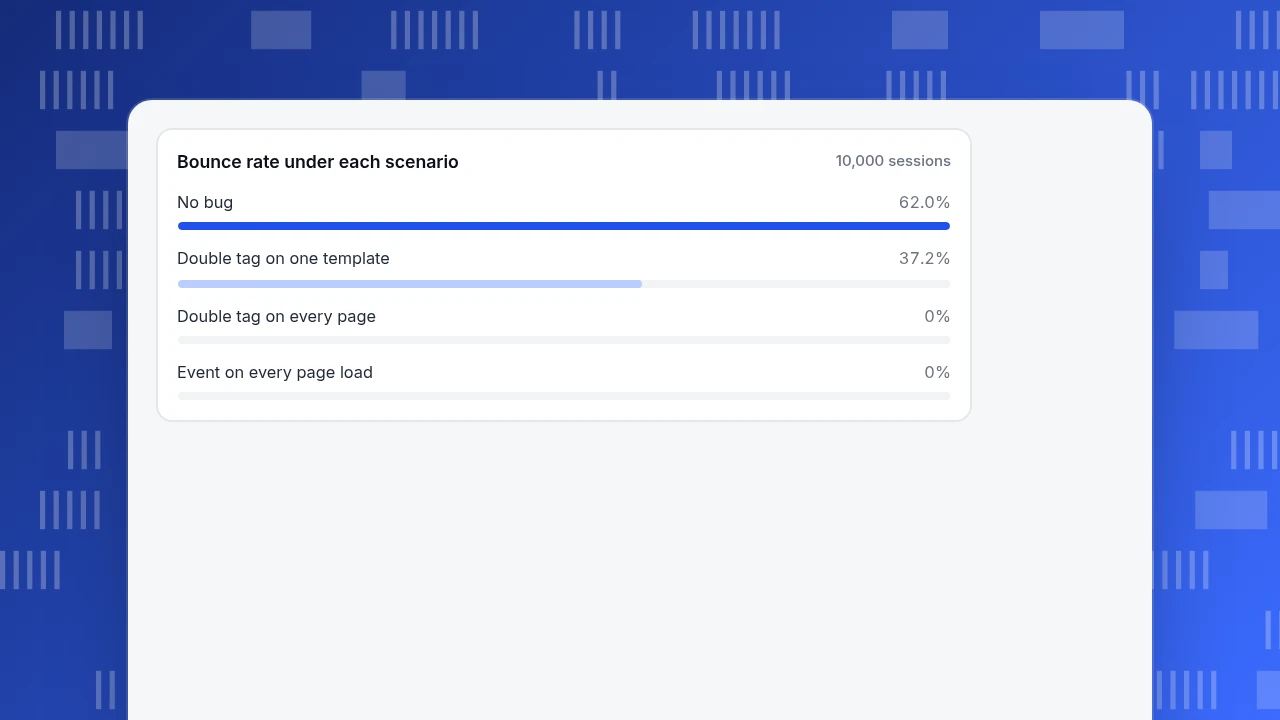
Sample data: a site had 10,000 sessions in a month. Before any bug, 6,200 sessions were one pageview and no event, so the bounce rate was 6,200 ÷ 10,000 = 62%. The other 3,800 sessions averaged 3.5 pageviews, so total pageviews were 6,200 × 1 + 3,800 × 3.5 = 19,500 and pages per session were 19,500 ÷ 10,000 = 1.95.
Now apply three bugs, one at a time.
| Scenario | Bounce rate | Pages per session | What changed |
|---|---|---|---|
| No bug | 62.0% | 1.95 | Baseline |
| Tag fires twice on every page | 0% | 3.90 | A one-page visit now has two pageviews; every pageview is doubled |
| Tag fires twice on one template (4,000 of 10,000 sessions land there) | 37.2% | 2.73 | 6,000 unaffected sessions × 62% = 3,720 bounces ÷ 10,000 |
| Event fires on every page load | 0% | 1.95 | Every session has an event; pageviews are unchanged |
Pages per session in the template case: 0.6 × 1.95 + 0.4 × 3.90 = 1.17 + 1.56 = 2.73.
Read the signatures. The double-tag bug moves both numbers: bounce collapses and pages per session doubles from 1.95 to 3.90. The event-on-load bug moves bounce but leaves pages per session at 1.95, so the clue is in the events list instead (an event whose count equals the pageview count). The partial case (37.2%) is the dangerous one, because it looks like a plausible improvement. This is why the first test is not "is the number low?" but "did it change on a date, and did anything else move on that date?"
Bounce rate under each scenario
10,000 sessionsWhat is the 15-minute test?
Follow these steps in order. Stop at the first one that finds a problem.
- Find the date it changed. On a daily chart, find the day the bounce rate dropped. If it dropped on one day, look for a release, plugin update or tag-manager publish on that day.
- Compare two numbers. Pull pages per session for the same days. If bounce fell and pages per session rose by a similar factor, suspect a duplicate tag. If only bounce fell, suspect an event.
- Count the requests. Open your site in a private window, open the network panel, load a landing page and count requests to your analytics endpoint. Expect one per page. Two means a double tag.
- Load a landing page directly. For single-page apps, enter the URL in the address bar (not by clicking from another page) and count again. Then click to a second screen and count again.
- Read the events list. Look for any event whose count is close to your pageview count. That is an event firing on load.
- Check by page. Sort pages by bounce rate. A handful of pages at 0% next to others at 60% means a template problem, not a content win.
- Check who is browsing. On a low-traffic site, a small group of internal visits can swing the average. Exclude team traffic and re-check.
Decision rule: if bounce is more than 25 points below its 8-week average and a pageview or event count rose by a matching factor on the same date, treat it as a bug and fix it before reporting the number. If the drop is gradual, is limited to pages you changed and pages per session and conversions moved with it, treat it as real. The 25-point threshold is a rule of thumb; use a wider band if your bounce rate is noisy.
After a fix, expect the history to stay wrong. Add a note on the date of the fix and do not compare across it.
How do you check this in TapCub?
Take the example above: bounce fell from 62% to 0% and pages per session doubled to 3.90. Here is how to check in TapCub, using only what the product does.

- Find the date. Open Web analytics › Overview and chart the daily bounce rate with pages per session and engaged rate as extra columns (columns come from the metric menu). Find the day it dropped. You can add a note for a release in Configuration › Annotations.
- Look at it by page. Open Web analytics › Pages. Visited pages show pageviews, entries, exits, average time and bounce rate; entry pages show sessions and pages contributed. A few pages at 0% beside others at 60% points to a template.
- Watch a visit live. Open Web analytics › Realtime, then load a landing page in a private window. The feed can be filtered to pageviews and custom events. You should see one pageview. Two pageviews at once means two tags; a custom event arriving at the same time as every pageview means an event on load. Recognised bots are in a separate feed and do not count in the online number.
- Check events. Open Web analytics › Events and read the counts. TapCub's own automatic events (outbound clicks, downloads) have names that start with a double underscore, so they do not stop a visit from counting as a bounce; your own events do.
- Re-read after the fix. Compare the weeks before and after, not days, and keep the annotation on the chart.
TapCub defines a bounce as one pageview and no custom event, and reports engaged rate separately (engaged means a duration of at least 10 seconds, at least 2 pageviews, or a goal event marked as a key event). If you find the script twice on a page, remove the second copy.
FAQ
What is considered a low bounce rate?
There is no single threshold, because it depends on the site type and the tool's definition. A tool or app can have a low value naturally. A figure far below your own history, or far below similar pages, deserves a check.
Is a low bounce rate always good?
No. If it falls overnight without a page change, suspect a duplicate tag, an event on page load or a single-page app reporting its first page twice. A low number only means success if conversions and time on page agree.
Why is my bounce rate 0%?
Usually every session has a second pageview or an event: a tag firing twice or an event on load. Count tracking requests for one page load; expect one.
How do I find a duplicate Google Analytics tag?
Use Google's Tag Assistant or the browser network panel, load one page and count requests to the analytics endpoint. More than one per page load means a duplicate.
Can a single-page app inflate bounce rate measurement?
Yes, in both directions. Page-change triggers that overlap with the initial load record the first page twice and push bounce down; missing page-change triggers push bounce up because the next screens are never counted.
Sources
- Google Analytics Help, [[GA4] Bounce rate](https://support.google.com/analytics/answer/12195621) (engaged session: more than 10 seconds, a key event or 2 or more page or screen views; checked 2026-11-20).
- Google Analytics Help, Remove duplicate tags after migrating to the Google & YouTube app on Shopify (duplicate tags and Tag Assistant; checked 2026-11-20).
- Google for Developers, Measure single-page applications (double-counting page views when history tracking and Google Tag Manager are both enabled; checked 2026-11-20).
Was this article helpful?
We use your answers to fix and expand this page.
Couldn’t send. Please try again in a minute.
Thanks for the feedback. We’ll use it to improve this page.You’ve already sent feedback on this page. Thanks.

Data Engineer
Writes about event design, data quality, and collection workflows, with verifiable implementation methods for reliable analytics.