Try it on your own data
Every report in this article is in the free plan. One snippet for web and apps, up to 10 sites.
Start freeAn MVP test checks one risky assumption about a product with real people, using the smallest build that can give a trustworthy answer. Write a plan with a hypothesis, a behavioural metric, a pass threshold set before launch and a decision for each outcome, and read small samples as ranges: in the sample below, the same 9.0% sign-up rate passes at 300 visitors but not at 100. Below: test types, a plan table, intervals and decision rules.
What you will learn
- Write hypothesis, metric, threshold and decision in a table before launching; thresholds set afterwards are set where the numbers already are
- A rate from a small sample is a range: 9.0% from 300 visitors is 6.3% to 12.8%, but from 100 visitors it is 4.8% to 16.2%
- Move down the commitment ladder from email to call to payment, and test the cheapest step that can falsify your riskiest assumption
What is an MVP test?
An MVP test is an experiment that checks one risky assumption about a product with real people, using the smallest thing that can produce a trustworthy answer. Eric Ries defined a minimum viable product as the version of a new product that lets a team collect the maximum amount of validated learning about customers with the least effort (Agile Alliance glossary). The stress is on learning, not on a small build: a landing page, a manual service or a prototype can all be an MVP if it answers the question.
An MVP test is therefore not a software test in the sense of QA, and it is not a vote of friends. It has four parts:
- A hypothesis: a sentence that can be wrong.
- A metric that measures it from behaviour, not opinion.
- A threshold written before the test starts.
- A decision attached to each outcome.
The rest of this page is about writing those four things down and checking them honestly. For the product concept itself, see minimum viable product; for the wider question of whether people want what you build, product validation.
How do you choose which assumption to test first?
Every product has a chain of assumptions: there is a problem, people feel it enough to act, they will find your solution, they will pay, they will come back. Test the riskiest link that is cheapest to test, not the one you find most interesting.
A quick way to rank them: for each assumption, score from 1 to 5 how much damage it does if it is false and how little evidence you have, and multiply. Test the highest product first. For a tool that reminds freelancers to chase unpaid invoices, the chain might be:
| Assumption | Damage if false | Lack of evidence | Risk (product) |
|---|---|---|---|
| Freelancers lose time chasing late payments | 5 | 3 | 15 |
| They want a tool, not a template email | 4 | 4 | 16 |
| They will pay a monthly fee | 5 | 5 | 25 |
| They will find us through search or communities | 3 | 4 | 12 |
Payment willingness ranks highest, but it is expensive to test before anything exists. The practical order is cheaper tests first (interest, then problem, then willingness to pay), each gated by the previous one, as in the plan below.
Which kind of MVP test fits your question?
| Test type | What it is | What it tests | Signal to record | Effort |
|---|---|---|---|---|
| Landing-page smoke test | A page that describes the product with a sign-up | Whether the promise attracts anyone | Sign-up rate by traffic source | Hours |
| Concierge | You deliver the service by hand to a few customers | Whether the outcome is valued | Repeat use, willingness to pay | Days |
| Wizard of Oz | The product looks automatic, a person works behind it | Whether the experience works before you automate | Task completion, return visits | Days to weeks |
| Pre-order or paid pilot | Customers pay before it exists | Willingness to pay, a strong signal | Payments, refund requests | Days |
| Single-feature product | One real feature, nothing else | Whether the core value stands alone | Week-1 and week-4 return | Weeks |
Pick the cheapest test that can falsify your riskiest assumption. A smoke test cannot tell you people will pay; a pre-order can.
| Test type | What it tests | Signal to record |
|---|---|---|
| Landing-page smoke test | Whether the promise attracts anyone | Sign-up rate by source |
| Concierge | Whether the outcome is valued | Repeat use, willingness to pay |
| Wizard of Oz | Whether the experience works before automating | Task completion, return visits |
| Pre-order or paid pilot | Willingness to pay | Payments, refund requests |
| Single-feature product | Whether the core value stands alone | Week-1 and week-4 return |
Pick the cheapest test that can falsify your riskiest assumption.
What goes into an MVP test plan?
Write the plan as a table before you launch. One row per hypothesis, with the threshold that decides it. Sample data for the invoice-reminder idea:
| Step | Hypothesis | Metric | Pass threshold | Sample result | Decision if it passes |
|---|---|---|---|---|---|
| 1. Landing page | Freelancers want this enough to leave an email | Sign-ups ÷ unique visitors | Rate ≥ 8%, and the lower end of the 95% interval ≥ 5% | 27 ÷ 300 = 9.0% (6.3% to 12.8%) | Invite sign-ups to a call |
| 2. Interviews | Sign-ups care enough to talk | Calls booked ÷ sign-ups invited | ≥ 20% | 8 ÷ 27 = 29.6% | Run the 8 calls |
| 3. Problem | The problem is current, not hypothetical | Interviewees who chased a late invoice in the last 30 days | ≥ 6 of 8 | 6 of 8 | Offer a paid pilot |
| 4. Willingness to pay | They will pay before it exists | Interviewees who pre-pay | ≥ 2 of 8 | 4 of 8 | Run a concierge pilot |
| 5. Early retention | The outcome is still wanted after two weeks | Pilot users active in week 2 | ≥ 50% of 12 | 7 of 12 = 58.3% | Build the thin product |
Rules for the table:
- Thresholds are set first. If you write them after seeing the numbers, they will be set where the numbers already are.
- Each step has a stop value too. If step 1 had returned an upper interval end below 5%, the decision would be "change the message or the audience, or stop".
- Small counts are directional. The 8 interviews and the 12 pilot users cannot prove a rate; they check whether the signal is there at all, as the next section shows.
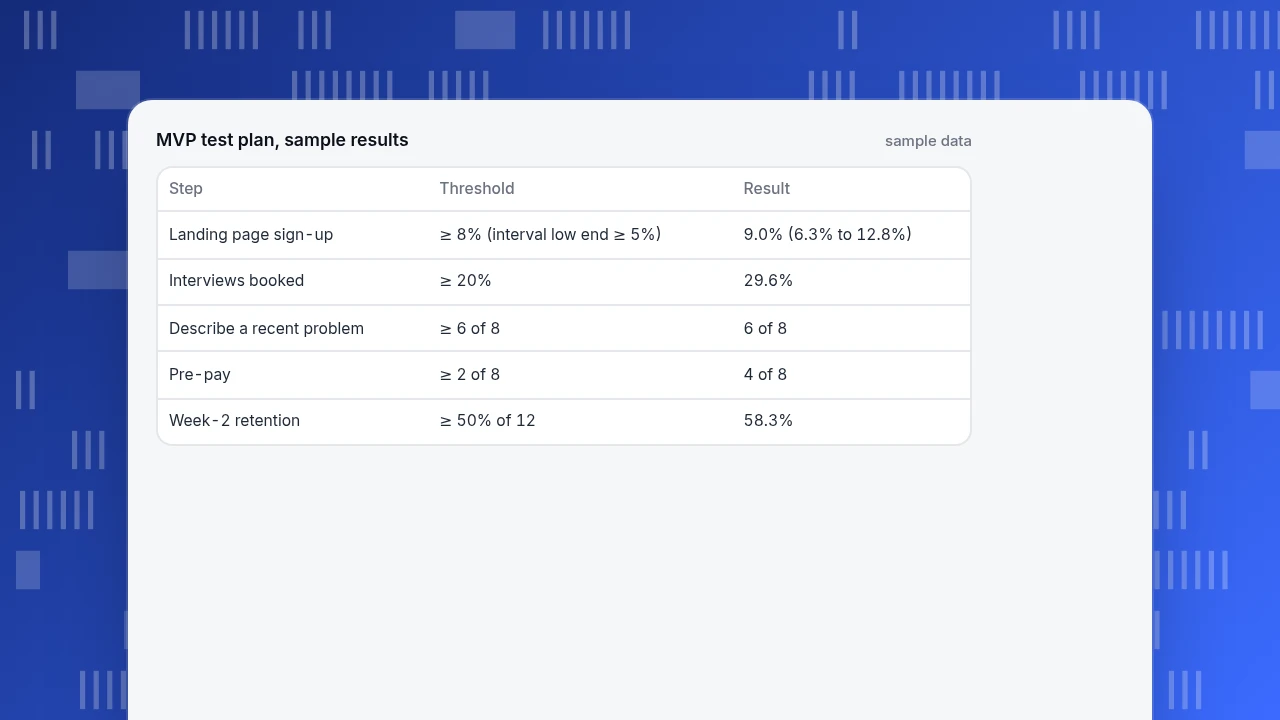
MVP test plan, sample results
sample data| Step | Threshold | Result |
|---|---|---|
| Landing page sign-up | ≥ 8% (interval low end ≥ 5%) | 9.0% (6.3% to 12.8%) |
| Interviews booked | ≥ 20% | 29.6% |
| Describe a recent problem | ≥ 6 of 8 | 6 of 8 |
| Pre-pay | ≥ 2 of 8 | 4 of 8 |
| Week-2 retention | ≥ 50% of 12 | 58.3% |
How many users do you need before you trust a result?
A rate from a small sample is a range, not a number. The Wilson interval is a standard way to compute it for a proportion, and NIST's handbook gives the formula (NIST/SEMATECH e-Handbook). With z = 1.96 for 95% confidence, the sample results above give:
| Result | Observed | 95% interval |
|---|---|---|
| 27 sign-ups from 300 visitors | 9.0% | 6.3% to 12.8% |
| 9 sign-ups from 100 visitors | 9.0% | 4.8% to 16.2% |
| 54 sign-ups from 600 visitors | 9.0% | 7.0% to 11.6% |
| 8 calls from 27 sign-ups | 29.6% | 15.9% to 48.5% |
| 4 of 8 pre-pay | 50.0% | 21.5% to 78.5% |
| 7 of 12 still active | 58.3% | 32.0% to 80.7% |
Read it twice. The same 9.0% is a pass at 300 visitors (lower end 6.3%, above the 5% floor) but not at 100 (lower end 4.8%, below it), so with 100 visitors the right decision is "keep collecting". And 4 of 8 prepaying is encouraging, but the interval stretches from 21.5% to 78.5%, which is why it triggers a pilot rather than a launch.
A rough sample-size rule for a rate near 9%: n = z² × p × (1 − p) ÷ margin². For a margin of ±5 points, 1.96² × 0.09 × 0.91 ÷ 0.05² ≈ 126 visitors; for ±2 points, ≈ 787. Plan traffic accordingly, or accept a wider interval and decide whether the decision survives it.
How do you test whether people would really miss it?
Behaviour tells you whether people act; a survey of existing users tells you whether they would miss the product. Sean Ellis's question, used by Superhuman, asks "How would you feel if you could no longer use the product?" with the answers very disappointed, somewhat disappointed and not disappointed. Ellis's benchmark across nearly 100 startups was 40% answering "very disappointed": companies below it usually struggled to grow, and those with strong traction usually exceeded it. Superhuman surveyed users who had used it at least twice in the last two weeks; it started at 22%, reached 33% after segmenting to the right users, and 58% after three quarters of product work, and the author notes that around 40 responses can be directionally useful (First Round Review).
For an MVP, apply it to your pilot users, not to sign-ups who never used anything. With 12 pilot users you will have far fewer than 40 answers, so read it as a signal for the interviews, not a score.
How do you decide: continue, change or stop?
| Outcome | What the data looks like | Decision |
|---|---|---|
| Clear pass | Every step above threshold with intervals above the floor | Build the thin product; set new thresholds for the next test |
| Mixed | Interest high, willingness to pay low | Test pricing or a narrower audience before building |
| Unclear | Rate near threshold, interval wide | Collect more data; do not change the threshold |
| Clear fail | Upper interval end below the stop value | Change the message, audience or idea, then rerun step 1; if two changes fail, stop |
What mistakes ruin MVP tests?
- Testing friends and colleagues. Their sign-ups say nothing about strangers. Count only visitors who came from your intended audience.
- Moving the threshold. Writing "8%" before and "5% is fine" after the numbers arrive is a decision to ignore the test.
- Counting clicks as demand. A click on a button is not a pre-order. Move down the commitment ladder: email, call, payment.
- Mixing sources. A sign-up rate across paid traffic and a community post hides which audience works. Report by source.
- Calling a small sample a result. Show the interval, as in the table.
How to run an MVP test with TapCub
TapCub does not run experiments, split traffic or send surveys; the Ellis question needs a separate survey tool. What it measures is behaviour: where visitors came from, whether they converted and whether they came back. For the invoice-reminder test:
- Tag each channel. Use
utm_source,utm_mediumandutm_campaignon every link you post, then read Web analytics › Sources: the UTM tab splits visitors and sessions by source, medium and campaign, and the channel table adds conversions, so sign-up rate by channel sits in one table. - Define the sign-up as a goal. In Web analytics › Goals, create a goal for the sign-up event or thank-you page. Its conversion rate divides by unique visitors in the range, which matches the sign-ups ÷ unique visitors metric in the plan.
- Identify people after sign-up. Call
tapcub.loginwhen a pilot user signs in, and the person appears in All-platform analytics › Users › People with a day-by-day behaviour timeline, useful for the concierge and pilot steps. - Check the steps and the return. In All-platform analytics › Behavior › Behavior analysis, build a funnel from landing page to sign-up to first use, and a retention report for the pilot cohort to compare with the week-2 threshold.
- Do the interval yourself. TapCub gives the counts and rates; compute the interval for small samples as in the table above, and write the decision in your plan.
FAQ
What is an MVP test?
An MVP test is an experiment that checks one risky assumption about a product with real people, using the smallest build that can give a trustworthy answer. It needs a hypothesis, a behavioural metric, a threshold written beforehand and a decision attached to each outcome.
How do you test an MVP with real users?
Start with the cheapest test that can falsify your riskiest assumption: a landing page for interest, interviews for the problem, a pre-order for willingness to pay, a concierge pilot for retention. Write thresholds beforehand and gate each step on the previous one.
How many users do you need to test an MVP?
It depends on the margin you can accept. For a rate near 9%, about 126 visitors give a margin of roughly five points and about 787 give two points. With fewer, report the interval: 9 sign-ups from 100 visitors is 9% but could be anywhere from 4.8% to 16.2%.
What is a good threshold for an MVP test?
There is no universal number. Set it from the economics: the sign-up rate you need to hit your cost per lead, or the pre-order share that makes the business viable. In the sample, 8% with a lower interval end of 5% was the bar. Choose yours before launching.
What is the difference between an MVP and a prototype?
A prototype demonstrates how something might work; an MVP is used with real customers to collect evidence about their behaviour. A prototype can be part of an MVP test, for example in a Wizard of Oz setup, but the test is defined by the hypothesis and the threshold, not by the artefact.
See also: PDLC vs SDLC: How Product and Software Lifecycles Differ.
Sources
- Agile Alliance. MVP (Minimum Viable Product) — the definition attributed to Eric Ries. Checked 2026-11-20.
- First Round Review. How Superhuman Built an Engine to Find Product/Market Fit — the 40% benchmark and Superhuman's 22%, 33% and 58%. Checked 2026-11-20.
- NIST/SEMATECH e-Handbook of Statistical Methods. Confidence intervals for proportions — the Wilson interval formula. Checked 2026-11-20.
Was this article helpful?
We use your answers to fix and expand this page.
Couldn’t send. Please try again in a minute.
Thanks for the feedback. We’ll use it to improve this page.You’ve already sent feedback on this page. Thanks.

Data Analyst
Explores traffic sources, conversion funnels, and retention, using clear metric definitions and concrete examples to explain what the numbers mean.