Try it on your own data
Every report in this article is in the free plan. One snippet for web and apps, up to 10 sites.
Start freeNRR (net revenue retention) is the share of last year's recurring revenue you still have from the same customers, counting upgrades; GRR (gross revenue retention) is the same with upgrades left out, so it cannot exceed 100%. Read GRR for the health of the base and NRR for how much expansion is covering it.
What you will learn
- NRR = (start + expansion − contraction − churn) ÷ start; GRR leaves expansion out and never exceeds 100%
- In the sample cohort NRR is 100.5% but GRR is 91.5%: $9,000 of upsell hides $8,500 of losses
- Compound monthly figures: 0.8% a month is 90.8% a year, not 90.4%; and check how much of NRR comes from one account
What do NRR and GRR measure?
Both metrics follow one fixed group of customers: the customers you had at the start of a period. They ask how much recurring revenue from that group you still have at the end, ignoring everyone who joined later. The difference is what they allow to count.
SaaS Capital, which publishes annual retention benchmarks for private B2B companies, defines NRR as the monthly recurring revenue (MRR) in December 2024 from customers who were also customers in December 2023, divided by their total MRR in December 2023. It includes upsells, cross-sells and price increases, so it can be well above 100%. GRR is the same calculation without upsells, cross-sells and price increases, so it can never exceed 100%.
In symbols, with start MRR as S, expansion as E, contraction as C and churned MRR as X:
- NRR = (S + E − C − X) ÷ S
- GRR = (S − C − X) ÷ S
The table sets them side by side.
| Item | NRR | GRR |
|---|---|---|
| Counts expansion (upsell, seats, price rise) | Yes | No |
| Counts churn and contraction | Yes | Yes |
| Counts new customers | No | No |
| Formula | (S + E − C − X) ÷ S | (S − C − X) ÷ S |
| Range | 0% to well above 100% | 0% to 100% |
| Sample cohort | 100.5% | 91.5% |
| Answers | Is the existing base growing in value? | How much of the base did we keep? |
S = start MRR of the cohort, E = expansion, C = contraction, X = churned MRR, all from the same customers over the same window.
How do the two formulas behave on the same cohort?
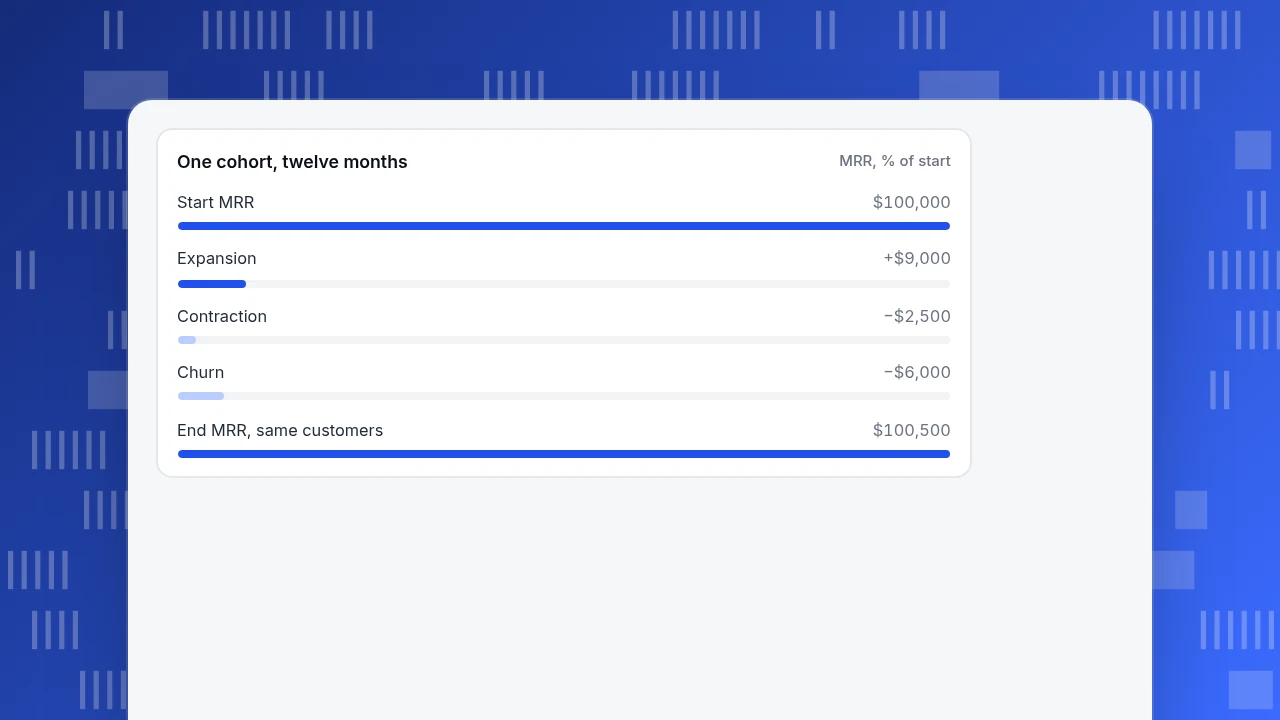
Sample data: 40 customers paying a combined $100,000 of MRR on 1 January. Over twelve months, this happens to the same group:
| Movement | Customers | MRR |
|---|---|---|
| Start MRR (S) | 40 | $100,000 |
| Churned: cancelled (X) | 3 | −$6,000 |
| Contraction: downgrades (C) | 4 | −$2,500 |
| Expansion: upgrades, extra seats, price rise (E) | 9 | +$9,000 |
| New customers won in the year | 6 | +$15,000 (not in either metric) |
Recomputed:
- NRR = (100,000 + 9,000 − 2,500 − 6,000) ÷ 100,000 = 100.5%
- GRR = (100,000 − 2,500 − 6,000) ÷ 100,000 = 91.5%
- Logo churn = 3 ÷ 40 = 7.5%, while revenue churn is 6.0%, because the cancelled accounts were smaller than average.
- Total MRR at year end = 100,500 + 15,000 = $115,500, which is growth of 15.5%.
Three different answers come from one year: 100.5% looks flat, 91.5% says one dollar in twelve of the starting base leaked away, and 15.5% growth hides both. New customers are why total growth and NRR diverge, which is the reason retention metrics exclude them. For a longer tour of the single-metric definitions, see net revenue retention and gross revenue retention.
One cohort, twelve months
MRR, % of startCan two companies have the same NRR and very different health?
Yes. Take a second cohort, also $100,000 of starting MRR, with churn of $1,000, contraction of $500 and expansion of $2,000:
| Cohort A | Cohort B | |
|---|---|---|
| Churn + contraction | $8,500 | $1,500 |
| Expansion | $9,000 | $2,000 |
| NRR | 100.5% | 100.5% |
| GRR | 91.5% | 98.5% |
Both cohorts print an NRR of 100.5%. Cohort B holds its base; cohort A is leaking 8.5% and relies on upsell to hide it. If the upsell slows, cohort A's NRR falls dollar for dollar, while cohort B barely moves. The rule: read GRR first for the health of the base, and NRR second for how much expansion is covering it.
How much of NRR rests on a single account?
NRR is a ratio of sums, so one large expansion can carry it. Suppose $6,000 of cohort A's $9,000 expansion came from one customer who added a team. Remove that account's upgrade and recompute:
NRR = (100,000 + 3,000 − 2,500 − 6,000) ÷ 100,000 = 94.5%
That is six points lower, and it changes the story from "flat" to "shrinking". Before you quote NRR, list the top three expansions as a share of total expansion. If one account is more than half, report NRR with and without it.
Why does a monthly figure not multiply into an annual one?
Retention compounds. If your gross revenue churn plus contraction is 0.8% a month, monthly GRR is 99.2%, but annual GRR is 0.992¹² = 90.8%, not 100% − 12 × 0.8% = 90.4%. Going the other way, an annual GRR of 91.5% means a monthly rate of about 99.3%, since 0.915^(1/12) = 0.9926. The shortcut gets worse as churn rises: at 3% a month, compounding gives 0.97¹² = 69.4%, while 100% − 12 × 3% gives 64%.
Two practical rules. First, never average monthly percentages into an annual one; compound them. Second, when you compare with a benchmark, check whether it is a 12-month cohort measure like the SaaS Capital definition above.
What counts as a good NRR or GRR?
There is no single number, because the definitions differ. SaaS Capital's 2025 benchmarks, published on 18 September 2025, report a median NRR of 102% for companies with an average annual contract value of $25,000 to $50,000, with a top quartile of 111% and a bottom quartile of 97%. A payments company's explainer, citing the same research, gives 2025 medians of 102% for NRR and 91% for GRR across SaaS companies. Treat both as ranges, and check the survey scope before comparing.
Public companies make the problem clearer. In their annual reports (Form 10-K) filed with the SEC, several define a net retention rate on annual recurring revenue (ARR) rather than MRR, some average the last four quarters, and some exclude acquired customers for the first year. Two companies can both say "net retention" and not be comparable. So benchmark yourself against yourself first: the same definition, the same cohort rule, quarter after quarter.
How do you build the cohort from billing data?
Most wrong NRR figures come from the cohort, not the formula. Build it in five steps:
- Fix the window. Pick start and end dates, for example 1 January and 31 December, and freeze the list of paying customers on the start date.
- Use recurring revenue only. Take MRR (or ARR divided by 12) from subscriptions. Leave out one-off setup fees, services and usage overage unless you report usage as recurring.
- Record each customer's start and end MRR. A customer who ends at zero is churn; one who ends lower is contraction; one who ends higher is expansion.
- Handle awkward cases by rule, not by hand. A customer who cancels and returns inside the window counts at their end value; one who joins after the start date is new and excluded; a price rise counts as expansion; a currency change should be converted at one fixed rate for the whole window.
- Sum the three buckets. Check that S + E − C − X equals the end MRR of the same customers. If it does not, a customer is in the wrong bucket.
Doing the reconciliation in step 5 is the cheapest way to catch a spreadsheet error before it reaches a board slide.
Which one should you report, and when?
Use decision rules rather than a favourite:
- Early stage, few customers: report GRR and logo churn; NRR is dominated by one or two accounts.
- Usage or seat pricing: report both; expansion is a built-in part of the model, so NRR near 100% with a low GRR is a warning.
- Fixed annual contracts, little upsell: NRR and GRR will be close; report GRR and say why.
- Board or investor update: report both with the cohort definition in one line and the top-three-expansion share.
- Diagnosing a drop in NRR: compute churn, contraction and expansion separately first, then compare cohorts by plan, size or start month.
How does TapCub fit when it does not calculate NRR?
TapCub is not a billing system and does not calculate NRR or GRR. Subscription revenue lives in your billing tool, and that is where S, E, C and X come from. TapCub's part is the behaviour that sits upstream of those movements, which tells you which accounts are likely to land in C or X.
- Compute the cohort in your billing data. Use the table above: start MRR, churn, contraction, expansion, new. The cohort rule is yours.
- Group people by account. After login, call
tapcub.group('company', 'acme', {...}). Under All-platform analytics › Users › Accounts you get account counts, 30-day active accounts, members and a health score from 0 to 100 (active members in the last 30 days 40 points, active days 30 points, seen in the last 7 days 30 points or in the last 30 days 15 points). - Look for the quiet ones. Sort by health. Accounts that were active last quarter and are quiet now are the shortlist for the contraction and churn lines in your cohort table. Anonymous visitors never join an account.
- Check retention by cohort. In All-platform analytics › Behavior › Behavior analysis, retention shows whether a group of people comes back in later periods. It measures people, not dollars.
- Know the boundary. The account view is an organisation view: it cannot open personal detail and cannot add segments to an analysis. TapCub does not send renewal reminders or discount offers; it only measures.
FAQ
What is NRR?
Net revenue retention is the recurring revenue you hold at the end of a period from the customers you had at the start, including upgrades and price increases, minus downgrades and cancellations, divided by their starting revenue. New customers are excluded. Above 100% means the existing base grew.
What is the difference between NRR and GRR?
NRR counts expansion; GRR does not. GRR only subtracts churn and contraction, so it cannot exceed 100%. In the sample cohort, NRR is 100.5% and GRR is 91.5%: expansion of $9,000 hides $8,500 of losses.
Can NRR be over 100%?
Yes. It exceeds 100% when expansion from existing customers is larger than churn plus contraction. That is why it is useful for subscription businesses with upsell. GRR cannot, because it excludes expansion.
Which is more important, NRR or GRR?
GRR shows whether the base is healthy; NRR shows whether expansion offsets losses. Read GRR first, then NRR. A high NRR with a weak GRR depends on upsell continuing.
How do you calculate NRR monthly or annually?
Pick one window and one cohort. For an annual figure, compare the same customers' MRR 12 months apart. Do not multiply monthly figures by 12; compound them, for example 0.992 to the power of 12 is 90.8%.
Sources
- SaaS Capital, SaaS Retention Benchmarks for Private B2B Companies (18 September 2025): NRR and GRR definitions; $25,000–$50,000 ACV band median 102%, quartiles 111% and 97%. Checked 2026-11-20.
- Stripe, Net revenue retention vs gross revenue retention: formulas and 2025 medians of 102% NRR and 91% GRR, attributed to SaaS Capital. Checked 2026-11-20.
- U.S. SEC EDGAR, Form 10-K filings with public net retention definitions on ARR: CrowdStrike, fiscal year ended 31 January 2025 (cohort of customers 12 months earlier, net of contraction and churn), SailPoint, fiscal 2025 (weighted average of the trailing four quarters), Smartsheet, fiscal 2024 (acquired ARR excluded for one year). Checked 2026-11-20.
Was this article helpful?
We use your answers to fix and expand this page.
Couldn’t send. Please try again in a minute.
Thanks for the feedback. We’ll use it to improve this page.You’ve already sent feedback on this page. Thanks.

Customer Experience Consultant
Writes about live chat, visitor conversations, and self-service, sharing practical ways to make customer communication clearer and more effective.