Try it on your own data
Every report in this article is in the free plan. One snippet for web and apps, up to 10 sites.
Start freeGrowth marketing strategies work only on the stage of the customer journey that is leaking, so find that stage before choosing a tactic. Compare each stage with your own best segment, estimate the extra customers from closing the gap, and divide by effort. In the sample, activation is the fix to start with: +12.2 customers for 4 weeks of work.
What you will learn
- Choose the stage first (acquisition, activation, retention, revenue, referral), then the strategy
- Compare each stage with your best segment, not an industry benchmark, and rank gaps by extra customers per week of effort
- Equal relative gains at any stage give the same lift, so the gap and the effort decide the order
Growth marketing strategies start with a map, not a list
A growth marketing strategy is a decision about where to put effort across the whole customer journey, not a menu of tactics. Lists of "10 growth strategies" all contain good ideas; the problem is that every idea is good for some stage and useless for another. Content marketing will not fix a product people abandon on day one. A referral programme will not fix a pricing page nobody reaches.
So the order of work is: find the stage where the journey leaks most, choose the strategy that acts on that stage, run the experiment so you can read it, and repeat. Everything below follows that order. For what growth marketing is as a discipline, see growth marketing; this article is about choosing what to do first.
The five stages as a bottleneck map
The most common map is the AARRR framework that Dave McClure presented in 2007: acquisition, activation, retention, referral and revenue. Its use here is simple. Each stage is a question your data can answer, and each question has one headline number.
| Stage | Question | Headline number | Typical symptom of a bottleneck |
|---|---|---|---|
| Acquisition | Do the right people arrive? | Visitor-to-sign-up rate by channel | Lots of visits, few sign-ups; a channel with traffic but no sign-ups |
| Activation | Do they reach the first useful moment? | Sign-up-to-activated rate | Many sign-ups never do the key action |
| Retention | Do they come back? | Retention at day 7, 30 or week 4 | Cohorts fall steadily and never flatten |
| Revenue | Do they pay? | Activated-to-paid rate | Healthy usage but little revenue |
| Referral | Do they bring others? | Share of new users from invites | Satisfied users, few invites |
The stages do not have to be tackled in strict order. The map shows where the problem is, and it does not matter whether that is the first stage or the fourth.
Which strategies act on which bottleneck
Match the strategy to the stage, not to what is fashionable. The table is a starting point; the example experiments are examples, not prescriptions.
| Bottleneck | Strategies that act on it | A first experiment | Metric to watch |
|---|---|---|---|
| Acquisition | Search content, partnerships, paid channels, email to an existing list | Move budget from the channel with the worst visitor-to-sign-up rate to the best | Sign-ups per channel and cost per sign-up |
| Activation | Shorter onboarding, templates, first-run checklist, help at the point of confusion | Remove one step from sign-up or onboarding | Share of sign-ups reaching the key action |
| Retention | Lifecycle email, product reminders, re-engagement, fixing the feature that cohorts stop using | Email people who stopped before the usual drop-off day | Retention curve at day 30 |
| Revenue | Pricing page clarity, plan packaging, trial length, upgrade prompts at the moment of need | Change the plan comparison layout | Activated-to-paid rate, revenue per user |
| Referral | Invite flows, shared outputs, reviews | Add an invite step after the first success | Share of new users from invites |
Most teams default to the first row because acquisition feels like growth. It is also the most expensive way to fill a leaky journey: acquiring a customer costs five to 25 times more than retaining one, according to Harvard Business Review, depending on the study and industry. If retention or activation is the leak, traffic spend is poured into it.
| Bottleneck | Strategies that act on it | Metric to watch |
|---|---|---|
| Acquisition | Search content, partnerships, paid channels, email to an existing list | Sign-ups per channel, cost per sign-up |
| Activation | Shorter onboarding, templates, first-run checklist | Share of sign-ups reaching the key action |
| Retention | Lifecycle email, reminders, re-engagement, fixing an unused feature | Retention curve at day 30 |
| Revenue | Pricing clarity, plan packaging, trial length, upgrade prompts | Activated-to-paid rate |
| Referral | Invite flows, shared outputs, reviews | Share of new users from invites |
Match the strategy to the leaking stage; a tactic that suits one stage does nothing for another.
How to find your bottleneck
You do not need an industry benchmark to find a bottleneck, and one would mislead you because definitions differ. Compare each stage with your own best segment.
- Build the journey with real numbers: visitors, sign-ups, activated users, paying customers, and retained users for a recent period.
- Split each stage by channel, device, country or plan. The segment with the highest rate is proof that a better rate is achievable for your product.
- Compute the gap: how many extra customers would you get if the average reached that best segment's rate at that stage?
- Check that the gap is a real cause, not noise. A segment with 30 users may be luck; require a few hundred.
- Write down what you believe causes the gap. A hypothesis you can test is an experiment; "improve onboarding" is not.
Worked example: where to spend the next six weeks
Sample data: a software product with 20,000 visitors a month.
- 3.0% of visitors sign up: 20,000 × 3.0% = 600 sign-ups.
- 35% of sign-ups reach the key action: 600 × 35% = 210 activated.
- 12% of activated users pay: 210 × 12% = 25.2 paying customers.
Now compare with the best segment at each stage. Sign-ups from the best channel convert at 3.6%, activation in the best onboarding path is 52%, and the best cohort pays at 15%.
| Closing the gap at... | New rate | Paying customers | Extra |
|---|---|---|---|
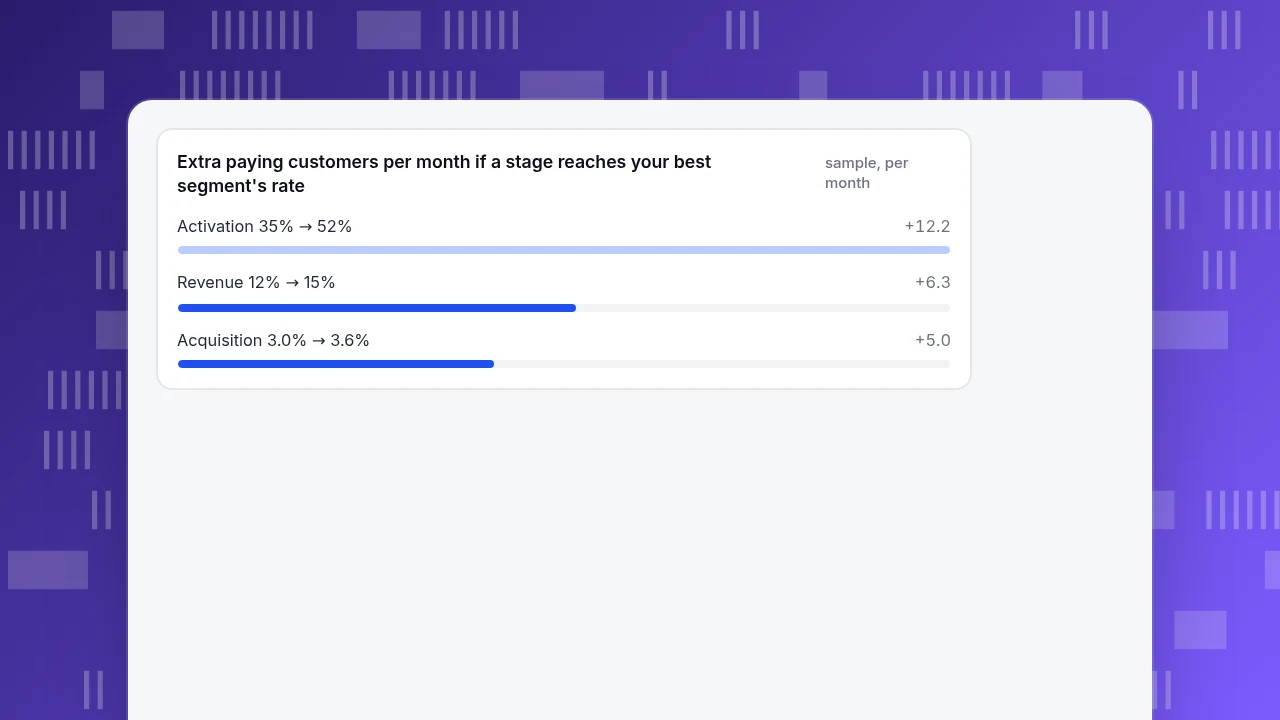
| Acquisition (3.0% → 3.6%) | 3.6% | 30.2 | +5.0 |
| Activation (35% → 52%) | 52% | 37.4 | +12.2 |
| Revenue (12% → 15%) | 15% | 31.5 | +6.3 |
| For comparison: double the traffic | 40,000 visitors | 50.4 | +25.2 |
Doubling traffic gives the biggest number, but it means doubling acquisition spend, and the leak stays. Activation gives the biggest gain among the three conversion fixes and costs only product work. Relative to rate, activation has an improvement of 52% ÷ 35% − 1 = 49%, against 20% for acquisition and 25% for revenue.
To rank by value for effort, add your own estimate of effort in weeks. Sample assumptions: activation 4 weeks, acquisition 2 weeks, revenue 3 weeks.
- Activation: 12.2 ÷ 4 = 3.1 customers per week of effort
- Acquisition: 5.0 ÷ 2 = 2.5
- Revenue: 6.3 ÷ 3 = 2.1
Activation is first on both value and value per effort, so it takes the next six weeks. The estimates are yours to change; the point is that the order comes from numbers, not from the tactic that is most fashionable.
Extra paying customers per month if a stage reaches your best segment's rate
sample, per monthWhy an equal improvement at any stage gives the same lift
This is the idea behind the ranking above, and it is easy to miss. Conversion stages multiply: 3.0% × 35% × 12% decides paying customers. If you improve any one stage by 20% relative, the result is the same: 25.2 × 1.2 = 30.2 customers, whether you improved acquisition, activation or revenue.
That has two consequences. First, you cannot decide by "which stage matters most", because they matter equally per percent. You decide by which stage can move by the largest percent for the least work, and the gap to your best segment is the evidence of that. Second, a stage that is already close to its ceiling, for example a payment step with 92% success, is a poor place to look even if it feels important.
Fix retention before you buy more traffic
Retention is the stage most likely to turn a growth effort into waste. If a cohort loses most of its users in the first week and never flattens, every new visitor is a short-term gain.
Look at the retention curve of recent cohorts. A curve that falls and then flattens means a core group stays, and you can grow by feeding more people into the product. A curve that keeps falling means you have a retention problem that acquisition cannot fix. Our article on retention metrics shows how to read the curve, and the AARRR first lever article explains when to start with retention rather than acquisition.
Run each strategy so you can read the result
A strategy you cannot evaluate teaches nothing. Four habits make an experiment readable:
- One change at a time against one metric, so the result has a single explanation.
- A decision rule written beforehand: "If activation rises from 35% to at least 40% over four weeks with similar traffic, we keep it."
- A comparison that is fair: same channels, same weeks of the month, no holiday in one half.
- A minimum size: do not stop the first time the number moves; wait for enough users to separate a real change from chance.
When you cannot randomise, compare the same segment before and after, and annotate the date of the change on your charts. Be honest about what a before-and-after comparison cannot rule out, such as seasonality.
Common mistakes
- Starting with the channel instead of the stage. Choosing "let's do TikTok" before you know where the journey leaks.
- Comparing with an industry benchmark that uses different definitions, instead of your best segment.
- Optimising a stage that is already near its ceiling.
- Running several experiments on the same stage at once, so no result can be attributed.
- Measuring clicks and sign-ups only, and calling it growth when nobody activates or stays.
- Never closing the loop: the experiment ends without a written decision.
- Spending on acquisition while retention falls.
In TapCub: find the leaking stage, then measure the fix
Take the example above: 20,000 visitors, a 3.0% sign-up rate, a 35% activation rate and a 12% paid rate. TapCub does not run experiments, split traffic, send lifecycle email or run ads; it measures the journey so you can choose and check.
- Build the funnel. In All-platform analytics › Behavior › Behavior analysis, pick the funnel and add your steps: visit, sign-up, key action, purchase. Each step shows the conversion from the previous one.
- Split by channel. Break the funnel down by channel or UTM campaign. The best-performing channel at each step is your best segment from the worked example.
- Read retention. In the same menu, open retention and set the start event to sign-up and the return event to your key action. The size-weighted average line shows whether the curve flattens.
- Check the cost. In All-platform analytics › Business › Channel ROI, import spend and read cost per click, cost per acquisition and return on ad spend by channel. Use it before moving budget in acquisition tests.
- Mark the change and compare. Add a date annotation under Configuration › Annotations on the day you ship the change, wait a full period, then run the same funnel over the weeks before and after (the funnel has no built-in compare period, so use two date ranges). For the AARRR layout in one page, see All-platform analytics › Business › AARRR growth.
For the planning side, see SaaS growth strategy.
FAQ
What are the best growth marketing strategies?
There is no single winner, because a strategy only works on the stage that is leaking. Acquisition strategies fit a stage with few sign-ups, onboarding changes fit weak activation, lifecycle email fits retention, and pricing changes fit low conversion to paid. Find the weakest stage first, then choose.
How do I choose a growth marketing strategy?
Build the journey with your own numbers, split each stage by segment, and compute how many extra customers you would gain if the average reached your best segment's rate. Divide that by an estimate of effort. The stage with the best value per effort goes first.
Should I focus on acquisition or retention first?
Check retention first. If your cohort curves keep falling and never flatten, new visitors are lost quickly and acquisition spend is wasted. If the curve flattens, acquisition is the better lever. Acquiring a customer costs five to 25 times more than retaining one, according to Harvard Business Review.
How many growth experiments should I run at once?
One per stage at most, and ideally one at a time on the same stage. Two simultaneous changes to onboarding cannot be separated, so you will not know which one worked. Different stages can run in parallel if they affect different parts of the journey.
How do I know if a growth strategy worked?
Decide the metric and the pass mark before you start, run it long enough to cover normal variation, and compare the same segment over the same kind of period. Without randomised groups, note what else changed, such as season or campaigns.
See also: Growth Engineering: How to Turn Growth Ideas Into Testable Changes.
Sources
- Dave McClure, Startup Metrics for Pirates (the acquisition, activation, retention, referral, revenue framework, 2007). Checked 2026-11-19.
- Amy Gallo, Harvard Business Review, The Value of Keeping the Right Customers (acquiring a customer is five to 25 times more expensive than retaining one). Checked 2026-11-19.
- Mixpanel, AARRR! Mixpanel for Pirates (the framework applied to product analytics). Checked 2026-11-19.
Was this article helpful?
We use your answers to fix and expand this page.
Couldn’t send. Please try again in a minute.
Thanks for the feedback. We’ll use it to improve this page.You’ve already sent feedback on this page. Thanks.

Product Experience Specialist
Explores usability, user journeys, and feature adoption through practical examples of onboarding and everyday product use.