Try it on your own data
Every report in this article is in the free plan. One snippet for web and apps, up to 10 sites.
Start freeBig data analytics examples share one thing: a specific question that someone will act on, answered by joining data that already existed. Retailers forecast stock, banks score fraud, energy firms predict failures. The data being big is the means, not the point. Below: eight examples by industry, the four traits they share, and a sizing calculation to tell whether your own data needs big data tools at all.
What you will learn
- Every strong example starts with a narrow question and a decision, not with the data or the platform
- Do the arithmetic first: 10 million events a month is about 120 GB a year, which one machine handles
- If you do not need a cluster, keep the question and shrink the data instead of dropping the idea
What makes something a big data analytics example?
NIST's big data framework describes big data as datasets with large volume, variety, velocity or variability that need a scalable architecture to store, handle and analyse efficiently. The key word is "need". A dataset is big for your purposes when one well-configured machine can no longer hold it or answer questions on it in a reasonable time. Plenty of impressive-sounding datasets fail that test, and plenty of everyday business questions pass it.
Use four checks before you call anything a big data example:
- Volume. The raw data no longer fits on one machine, or one query would take hours.
- Variety. The answer needs several kinds of data joined together: clicks, text, sensor readings, transactions.
- Velocity. Records arrive continuously and the answer is only useful within seconds or minutes.
- A decision. Someone changes what they do because of the result. Without this, it is storage, not analytics.
The fourth check is the one the examples below have in common, and the one most "big data" projects skip. The types of analysis involved (descriptive, diagnostic, predictive, prescriptive) are covered in types of data analytics.
| Check | Question to ask | Passes when |
|---|---|---|
| Volume | Does the raw data fit on one machine? | It does not, or one query takes hours |
| Variety | Do you need several kinds of data joined? | Clicks, text, sensors or transactions must be combined |
| Velocity | Does the answer expire quickly? | Records arrive continuously and value fades in minutes |
| Decision | Will someone act on the result? | A named owner changes an order, a block or a booking |
Fail the decision check and it is storage, not analytics, however big the data is.
Big data analytics examples by industry
Each row names the question first, because the question is what makes the example work. No company is named: these are patterns that appear across many organisations.
| Industry | The question | Data joined | Why it needs scale |
|---|---|---|---|
| Retail | Which products should be stocked in which store next week? | Point-of-sale lines, weather, local events, stock levels | Millions of line items per day across thousands of products and stores |
| Telecom | Which cells are about to be overloaded? | Network counters, call records, device types | Continuous streams from every cell, decisions needed in minutes |
| Logistics | Which route reorders deliveries to hit more time windows? | GPS pings, traffic, order data, depot capacity | A ping every few seconds per vehicle; many route options to compare |
| Healthcare | Which patients are at risk of readmission? | Admissions, labs, medications, notes | Many record types per patient; privacy rules constrain where data may sit |
| Banking | Is this card payment fraudulent? | Transaction history, device, location, merchant | Scoring must finish in milliseconds against years of history |
| Energy | When will this turbine need maintenance? | Vibration and temperature sensors, repair logs | Thousands of sensors sampling many times a second |
| Media | What should each viewer be shown next? | Watch history, search, ratings, catalogue metadata | Huge numbers of viewers by huge numbers of titles |
| Manufacturing | Which batch is likely to fail inspection? | Machine settings, sensor traces, supplier lots | High-frequency data from every step of the line |
Notice what the table does not say. None of the rows is "analyse all our data." Each one is a narrow question with a clear owner who will act on the answer.
What the examples have in common
Read across the rows and the same four traits appear, none of which is about technology.
- The question was specific before the data was collected. "Which patients are at risk of readmission?" can be answered or not. "Find insights in our patient data" cannot.
- The data already existed as a by-product of operations. Tills, GPS units and sensors produce records whether or not anyone analyses them. The project joins them; it does not start collecting from scratch.
- Joining sources is the hard part. The value comes from combining weather with sales, or sensors with repair logs. Most of the effort goes into matching identifiers and fixing formats, a problem covered in data pipelines.
- The result closes a loop. A forecast changes an order, a fraud score blocks a payment, a maintenance alert books an engineer. The measure of success is the decision, not the dashboard.
If your own project lacks the first trait, scale will not help. If it lacks the fourth, you are building an archive. How these traits fit into an overall plan is the subject of data strategy.
How to tell whether you need big data tools
Start with arithmetic. Estimate events per month, bytes per event, and then a year of storage.
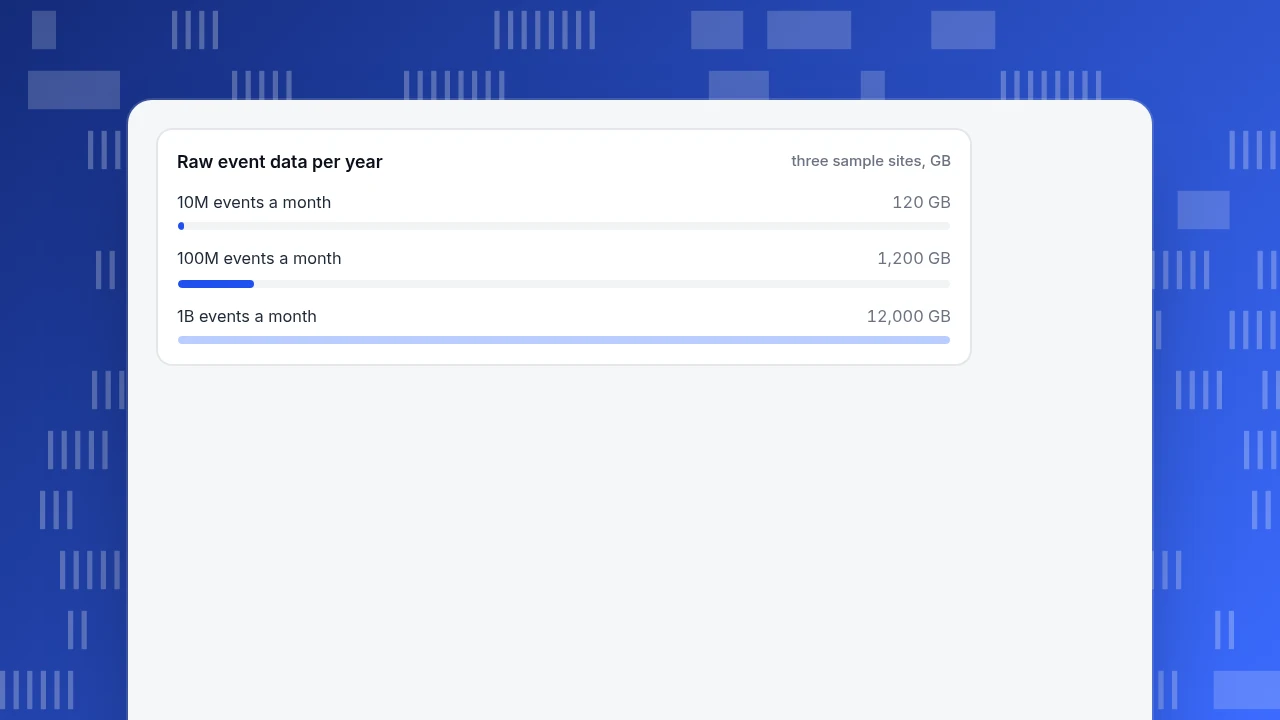
Sample data: an online store with 400,000 sessions a month and about 25 tracked events per session records 400,000 × 25 = 10,000,000 events a month. At a generous 1,000 bytes per raw event, that is 10 GB a month and 120 GB a year. A laptop disk holds that many times over. The table shows how the same arithmetic grows:
| Events per month | Raw size per month | Raw size per year | Where the answer changes |
|---|---|---|---|
| 10 million | 10 GB | 120 GB | One database or one machine is plenty |
| 100 million | 100 GB | 1.2 TB | Still one machine, but plan indexes and summaries |
| 1 billion | 1 TB | 12 TB | A warehouse or a distributed engine starts to pay off |
The 1,000-byte figure and the cut-offs are working assumptions, not a standard; compressed columnar storage is often several times smaller. Re-run the arithmetic with your own event size.
Two refinements make the estimate more honest. First, count what you will keep: if you store only the last 13 months of detail and summarise the rest, storage stops growing every year. Second, count the busiest month, not the average. If peak season brings three times the traffic, plan for 30 million events that month, or 30 GB at the same event size. Neither refinement changes the conclusion for most sites, but they stop a one-off spike from being mistaken for a permanent need for a cluster.
Models are smaller still. A churn model with 50,000 accounts and 40 numeric features, stored as 8-byte numbers, is 50,000 × 40 × 8 = 16,000,000 bytes, 16 MB. It fits in memory on any current laptop.
Distribution also has a cost. A widely cited paper by McSherry and colleagues defined "COST" as the hardware a distributed system needs before it beats a competent single-threaded program, and found that several published systems needed hundreds of cores, or never won at all, on the workloads they reported. Before buying a cluster, test the question on one machine.
Raw event data per year
three sample sites, GBBig data example, small data version
Most mid-sized teams can run a version of each example at a size that fits one database. The pattern is to keep the question and shrink the data.
| Big data example | Small data version | Typical size |
|---|---|---|
| Next-item recommendations for every viewer | "Customers who bought this also bought" counts over the last 12 months of orders | One table of order lines |
| Fraud scoring over years of history | Rules on order value, shipping mismatch and repeated failed cards, reviewed weekly | Thousands of orders a day |
| Predictive maintenance on thousands of sensors | Alert when one reading stays above its limit for a set time | A few machines, one reading each |
| Demand forecasting by store and product | Last year's same-week sales, adjusted by the recent trend | Weekly totals per product |
| Funnel analysis across all user events | Counts of users reaching each step in a 30-day window | Tens of millions of events |
The last row is the one most web teams meet first, and it needs no special platform: product analytics tools already store and query event data at that size.
Common mistakes with big data analytics
- Starting from the platform. Buying infrastructure before naming a decision leaves a costly system with no users.
- Counting data volume as value. The 120 GB store above may answer more business questions than a 12 TB log nobody joins to orders.
- Skipping the join keys. If visitors, orders and support tickets have no shared ID, adding more data adds noise.
- Ignoring freshness. A daily batch is fine for planning stock and useless for blocking fraud. Decide how fresh the answer must be before choosing tools.
- Treating prediction as the goal. A model that predicts churn but triggers no action moves no number.
- Forgetting privacy. Joining more sources raises the chance of identifying people; limit what you collect to what the question needs.
Where TapCub fits
Take the store from the sizing example: 10 million events a month and a question: where do shoppers leave between product page and payment? TapCub handles that size without a data team.
- Collect the events. Install the script and send the events you need (product view, add to cart, checkout start, purchase). Define them in All-platform analytics › Data › Events & properties.
- Answer the question. Build a funnel in All-platform analytics › Behavior › Behavior analysis, then split it by device or channel to see where the leak is.
- Go further with SQL. If the funnel is not enough, All-platform analytics › Behavior › Metrics & SQL lets you query the event data directly and define your own metrics.
- Export when you outgrow it. All-platform analytics › Data › Data export runs an asynchronous export of raw detail for your own warehouse. Export covers events kept within the retention period.
- Know the boundary. TapCub does not run distributed processing, train machine-learning models or join your finance and support systems for you. It measures behaviour on your site, apps and chat; the rest stays in your own stack.
FAQ
What are some examples of big data analytics?
Retailers forecasting demand by store, telecom operators predicting overloaded cells, banks scoring card payments for fraud, energy companies predicting equipment failure from sensors, and healthcare providers estimating readmission risk. Each starts with a specific question, joins several data sources and feeds a decision such as an order, a block or a maintenance booking.
How do you know if your data is big data?
Compare it with one machine. If the raw data fits on a single disk and your queries finish in minutes, it is not big for your purposes, whatever its absolute size. Estimate events a month times bytes per event times twelve; tens or hundreds of gigabytes a year is ordinary database territory.
Do small businesses need big data analytics?
Usually not the tools, but they do need the habit: a specific question, joined data and a decision. A store with ten million events a month can run funnels, retention and segmentation on a standard analytics product and keep a spreadsheet for the rest.
What is the difference between big data and data analytics?
Big data describes the size and shape of the data; analytics is the work of turning data into answers. You can do analytics on small data, and you can store big data without analysing it. A big data analytics example needs both.
Sources
- NIST. NIST Big Data Interoperability Framework, Volume 1: Definitions (SP 1500-1r2) — definition of big data by volume, variety, velocity and variability.
- Frank McSherry, Michael Isard & Derek Murray. Scalability! But at what COST? HotOS XV, 2015 — the COST measure for distributed systems.
- Jeffrey Dean & Sanjay Ghemawat. MapReduce: Simplified Data Processing on Large Clusters. Google, 2004 — the programming model for processing very large datasets across machines.
Was this article helpful?
We use your answers to fix and expand this page.
Couldn’t send. Please try again in a minute.
Thanks for the feedback. We’ll use it to improve this page.You’ve already sent feedback on this page. Thanks.

Data Engineer
Writes about event design, data quality, and collection workflows, with verifiable implementation methods for reliable analytics.