Try it on your own data
Every report in this article is in the free plan. One snippet for web and apps, up to 10 sites.
Start freeBuyer intent signals are visitor behaviours that statistically precede a purchase or enquiry: viewing pricing, returning within days, opening a chat, reading several product pages, starting a form. Their strength is specific to your site, so measure it: in a sample of 20,000 visitors, the 15% who opened chat or viewed pricing produced 65% of demo requests. Below is a signal table and a way to turn it into scores.
What you will learn
- Measure each signal's conversion against your base rate rather than copying a generic list
- Give each visitor the points of their strongest signal, not the sum, because signals overlap
- Record when a signal happened: a pricing view in the last 3 days converted at 14.0% against 7.6% for older ones
What are buyer intent signals on a website?
Buyer intent signals are the things a visitor does that statistically precede a purchase or enquiry: viewing pricing, coming back within days, opening a chat, reading comparison or integration pages, or starting a form. They matter because most of a buyer's research happens where you cannot see it. Gartner's 2026 survey of 646 B2B buyers (fielded August to September 2025) found 67% prefer a rep-free buying experience, and its 2025 release found 73% avoid suppliers that send irrelevant outreach. If buyers research alone and punish bad timing, the signals they leave on your own site are how you tell who is ready.
This page is about first-party signals, the ones your own analytics records. Third-party intent data (topic research elsewhere on the web) is a different product and is covered in intent data for sales. The goal here is a signal-to-score table you can build from your own numbers, not a generic list. Tracking the leads that result is in lead tracking.
Which website signals show buying intent?
| Signal | What the visitor did | Why it suggests intent | Caveat |
|---|---|---|---|
| Pricing page view | Opened pricing or plans | Cost is a late-stage question | Competitors and students also look |
| Repeat visit | Returned within 7 days | Still evaluating after the first visit | Includes support users and employees |
| Chat opened | Started a conversation | Asked a question a page did not answer | People who chat are self-selected |
| Product or integration pages | Viewed 3 or more | Checking fit | Researchers read as much as buyers |
| Comparison page | Read how you differ | Choosing between options | Often early, often anonymous |
| Form started | Began sign-up or demo form | Highest effort so far | Abandoned forms are intent too, not failures |
| Return from a campaign | Arrived from an email you sent | Already known to you | Source tells you who, not when |
| Logged-in activity | Used the product (trial or free plan) | Direct evidence of value | Only identified users |
The honest limit of this table is the caveat column. Every signal is a probability, not a verdict, and the strength of each is specific to your site. That is why the next section computes the strength from your own data.
| Signal | Points (rate, rounded) | Suggested action |
|---|---|---|
| Chat opened | 25 | Reply within minutes; hand to sales on price questions |
| Pricing viewed | 10 | Offer help on the page; follow up if identified |
| Repeat visit within 7 days | 4 | Show a relevant next step; add to nurture |
| 3+ product pages | 2 | Keep educating; no sales contact |
| None of these | 0 | Do not spend effort |
Points are the sample conversion rates; use the strongest signal per visitor and recompute quarterly.
How strong is each signal? A worked example
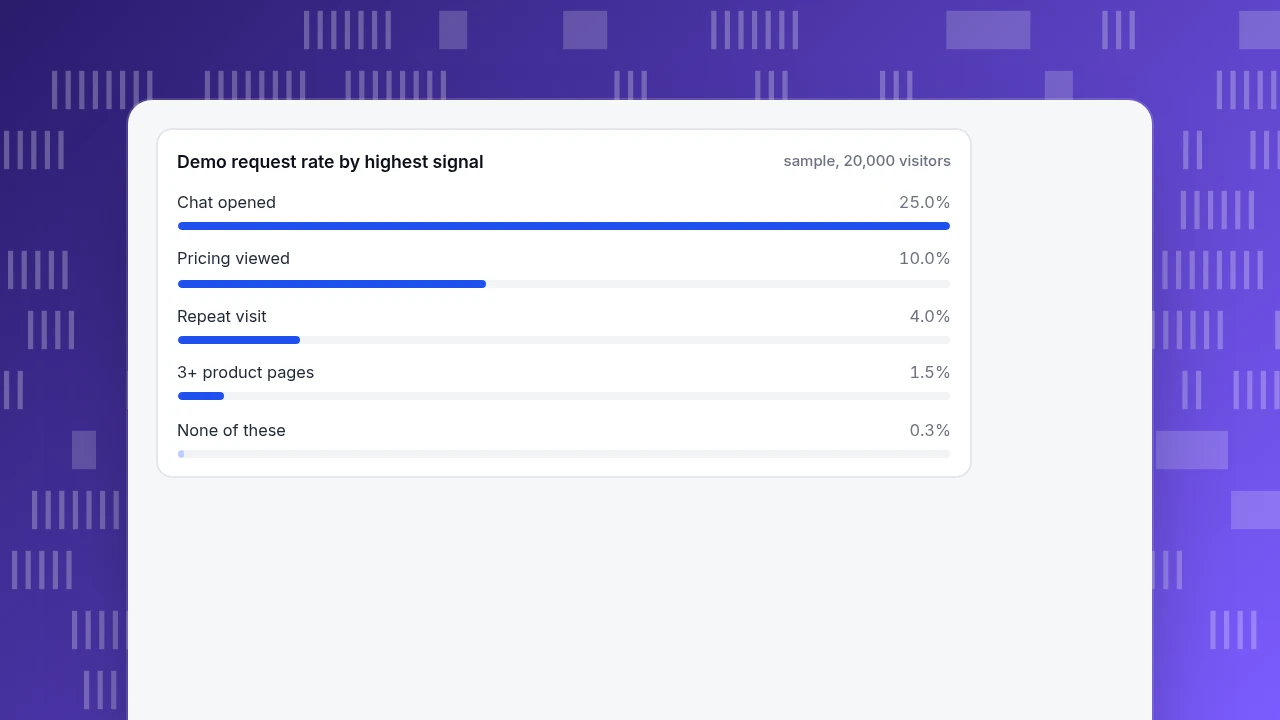
Sample data: 20,000 visitors in a month, 600 of whom requested a demo, so the base rate is 600 ÷ 20,000 = 3.0%. Because signals overlap, assign each visitor to the highest-intent signal they showed (chat, then pricing, then repeat visit, then product pages), so the groups do not double-count:
| Highest signal | Visitors | Demo requests | Rate | Lift vs 3.0% | 95% interval |
|---|---|---|---|---|---|
| Chat opened | 600 | 150 | 25.0% | 8.3× | 21.7% to 28.6% |
| Pricing viewed | 2,400 | 240 | 10.0% | 3.3× | 8.9% to 11.3% |
| Repeat visit within 7 days | 3,000 | 120 | 4.0% | 1.3× | 3.4% to 4.8% |
| 3+ product pages | 4,000 | 60 | 1.5% | 0.5× | 1.2% to 1.9% |
| None of these | 10,000 | 30 | 0.3% | 0.1× | 0.2% to 0.4% |
| Total | 20,000 | 600 | 3.0% | n/a | n/a |
The groups add back to 20,000 visitors and 600 requests. The first two groups are 3,000 ÷ 20,000 = 15% of visitors but produce (150 + 240) ÷ 600 = 65% of demo requests. That is the reason to score: it tells sales which 15% to call first.
Lift is rate ÷ base rate. Chat at 8.3× is the largest, and also the one most inflated by self-selection: people who open a chat are already closer to asking for a demo. Treat it as an upper bound for what chat adds, and as a very strong signal of who is ready.
Demo request rate by highest signal
sample, 20,000 visitorsHow do you turn the table into a score?
Use the observed rate as the points, rounded, and give a visitor the points of their strongest signal rather than the sum, because overlapping signals would otherwise count the same intent twice:
| Signal | Points (rate, rounded) | Suggested action |
|---|---|---|
| Chat opened | 25 | Reply within minutes; hand to sales if the question is about price or terms |
| Pricing viewed | 10 | Offer help on the pricing page; follow up if identified |
| Repeat visit within 7 days | 4 | Show a relevant next step; add to a nurture sequence |
| 3+ product pages | 2 | Keep educating; no sales contact |
| None of these | 0 | Do not spend effort |
A visitor who opened a chat and viewed pricing has 25 points, not 35. Adjust the thresholds with a holdout: after a month, check whether visitors scored 10 or more actually convert at about 10% or higher, and recompute the rates each quarter because they drift.
Agree a response time for each tier before you launch the score, for example a reply to an opened chat within 5 minutes during office hours, a follow-up to a pricing view within one working day, and an entry in the weekly nurture cycle for repeat visitors. A score nobody acts on within a day or two loses most of its value, as the freshness table later on this page shows, and a tier with no owner is only a report.
How many visitors do you need before trusting a rate?
Enough that the interval is narrower than the gap between neighbouring tiers. In the sample, chat's interval of 21.7% to 28.6% sits clearly above pricing's 8.9% to 11.3%, so the ranking is solid. If the chat group had only 40 visitors with 10 requests, the same 25.0% would have an interval from about 14% to 40%, wide enough to overlap pricing's range. Under about 100 visitors, treat a rate as a hint. Combine two weeks of data rather than splitting a month into days.
How quickly does a signal go stale?
A signal loses value with age, so record when it happened, not only that it did. Split the 2,400 pricing viewers in the sample by how long before the month's end they viewed pricing:
| Pricing viewed | Visitors | Demo requests | Rate |
|---|---|---|---|
| In the last 3 days | 900 | 126 | 14.0% |
| 4 to 14 days ago | 1,500 | 114 | 7.6% |
| All pricing viewers | 2,400 | 240 | 10.0% |
The rows add back to 2,400 visitors and 240 requests. A fresh pricing view is worth about twice an older one (14.0% against 7.6%), so the sensible rule is to award full points inside a short window and fewer after it, for example 10 points within 3 days and 5 points within 14 days. Pick the cut-offs from your own sales cycle: a product bought in one session needs hours, one with a procurement process needs weeks.
What signals mislead?
- Counting your own team and customers. Exclude internal traffic and existing customers, or the repeat-visit and docs signals inflate.
- Treating one signal as a buyer. A single pricing view by one anonymous visitor is 10% in the sample, which also means 90% do not request a demo.
- Adding overlapping signals. Use the strongest, or test the combination as its own group.
- Reading chat as proof that chat works. Self-selection inflates the gap; compare against similar visitors.
- Ignoring the buyer who never shows a signal. Gartner's 2025 release found 69% of buyers noticed inconsistencies between a seller's website and what the rep said, so a mismatch can end an evaluation before any signal appears.
- Never recalculating. A scoring table from last year reflects last year's pricing page and traffic.
How do you capture these signals in TapCub?
Take the sample above. In TapCub:
- Measure the signals. Pricing and product page views come from Web analytics › Pages; new versus returning visitors from Web analytics › Audience; opened chats from Live chat › Inbox. Set a goal for the demo request in Web analytics › Goals so each signal's conversion can be computed.
- Compare chatted with not chatted. Live chat › Reports › Conversion attribution compares goal conversion for visitors who chatted and those who did not, warns when fewer than 30 chatted, and lists the pages where chats start.
- Know who they are. If your product has a login, call
tapcub.login; the person then appears in All-platform analytics › Users › People with a day-by-day behaviour timeline, and the chat shows who it is without asking for an email. - Define the groups. In All-platform analytics › Users › Segments & tags, build a rule segment such as "did Pricing viewed in the last 7 days and did not do Demo requested"; identified people only, since anonymous visitors do not enter segments.
- Open the visitor. In a chat, the sidebar shows source, the last 2 days of pages and past conversations, with one click to the visitor profile.
TapCub does not score leads or push them to a CRM; it records the signals and shows each one's conversion so that you can set the scores yourself.
FAQ
What are examples of buyer intent signals?
Viewing the pricing page, returning within a few days, opening a chat, reading three or more product or integration pages, starting a form, arriving from a campaign you sent, and using a free plan or trial. Strength differs by site, so measure each against your own conversions.
How do you identify buyer intent on a website?
Record the page views and events that precede a conversion, compute each signal's conversion rate against your base rate, and rank them. In the sample, chat open converted at 25.0% and pricing view at 10.0% against a 3.0% base.
What is the difference between first-party and third-party intent data?
First-party data is what visitors do on your own site and is recorded by your analytics. Third-party intent data comes from activity elsewhere on the web, collected by data providers. This page covers first-party signals; the other is discussed in the intent data article.
Do buyer intent signals work for B2C?
Yes. A shopper who views a product page three times, adds to cart and returns the next day shows intent in the same way; the signals differ (cart, wishlist, price checks) but the method of measuring each against a base rate is the same.
How many signals should I score?
Three to five. Beyond that, signals overlap and the table becomes hard to maintain. Start with chat, pricing and repeat visit, and add one only if it separates visitors who convert from those who do not.
Sources
- Gartner. Gartner Sales Survey Finds 67% of B2B Buyers Prefer a Rep-Free Experience — 646 buyers, August to September 2025; press release of 9 March 2026. Verified 2026-11-20 through the release's search listing (the page blocks automated fetches).
- Gartner. Gartner Sales Survey Finds 61% of B2B Buyers Prefer a Rep-Free Buying Experience — 632 buyers; 73% avoid irrelevant outreach and 69% report website-versus-rep inconsistencies; press release of 25 June 2025. Verified 2026-11-20 through the search listing.
Was this article helpful?
We use your answers to fix and expand this page.
Couldn’t send. Please try again in a minute.
Thanks for the feedback. We’ll use it to improve this page.You’ve already sent feedback on this page. Thanks.

Product Analyst
Focuses on event analysis, conversion funnels, and retention, using clear metric definitions and structured analysis to explain product performance.