Try it on your own data
Every report in this article is in the free plan. One snippet for web and apps, up to 10 sites.
Start freeTo use intent data for sales, pick a few first-party signals such as pricing visits, return visits and chat, give each a score, test the score against past wins and turn the bands into time-limited actions. In the sample, the top two bands held 12.9% of 7,000 leads but 49.5% of the 204 wins, so those leads get same-hour or same-day follow-up. Below: the signal table, a scored example, the backtest and a routing rule.
What you will learn
- Start with first-party signals and give points only to signals that change what sales says or when
- Backtest the score on past leads: a useful score puts a small share of leads at the top with a large share of wins
- Turn bands into actions with time limits and check rep capacity before promising a response time
What is intent data, and which kind can sales use today?
Intent data is evidence that a person or company is interested in buying, taken from what they do. It comes in two kinds. First-party intent is what you see on your own properties: pages visited, return visits, chat conversations, form fills, product usage. Third-party intent is research activity on other sites, bought from a data provider. This guide is about the first kind, because it is the one a sales team can start using this week with no purchase, and it is the kind you can check against your own closed deals.
The method has three parts: choose a handful of signals, give each a score you can defend, and decide what the sales team does at each score. Turning a visitor into a lead is covered in live chat lead generation; how intent signals are read at account level is in account-based marketing analytics; and the lead stage this feeds is defined under marketing qualified lead. Here the focus is narrower: a signal-to-score table, a worked score, a test of whether the score predicts wins, and a routing rule.
Why does relevance matter more than volume?
Buyers have views about being contacted, and they have data behind them. Gartner's June 2025 survey of 632 B2B buyers, fielded in August and September 2024, found that 61% prefer an overall rep-free buying experience, that 73% actively avoid suppliers who send irrelevant outreach, and that 69% report inconsistencies between a seller's website and what sellers tell them. The same release reports that buyers prefer online self-service for general information and talking to a seller for judgement calls such as whether a product fits their company.
Read that as a design constraint for intent data. A score is only useful if acting on it makes the outreach more relevant: right topic, right moment, right person. If a signal does not change what you say or when you say it, it should not get points. That rule is also the easiest way to cut a long signal list down to a short one.
Which signals deserve points?
| Signal | What it suggests | Sample points | Caveat |
|---|---|---|---|
| Visited the demo or contact page | Asking for a conversation | 40 | Only meaningful before the form, since a submit is already a lead |
| Visited the pricing page | Comparing cost | 30 | Existing customers also visit it |
| Second visit within 7 days | Still evaluating | 15 | A single long session can mean the same |
| Chat conversation about buying | Specific question to a human | 25 | A support question is not intent |
| Read integration or documentation pages | Checking fit with their stack | 10 | Developers and buyers differ |
| Read a case study or comparison page | Building a shortlist | 10 | Weak on its own |
| Visited the careers page | Looking for a job | −20 | A negative signal |
| Known bot or crawler | Not a person | Exclude | Count nothing |
The points are sample values for you to replace. The method for replacing them is in the backtest section below: your own closed deals tell you which signals matter in your business.
| Signal | Sample points |
|---|---|
| Visited demo or contact page | 40 |
| Visited pricing page | 30 |
| Chat about buying | 25 |
| Second visit within 7 days | 15 |
| Visited careers page | −20 |
Sample values; replace them after your own backtest.
How do you score four visitors?
Sample data: four visitors in one week.
| Visitor | What they did | Score |
|---|---|---|
| A | Pricing page, came back three days later, then started a chat about plans | 30 + 15 + 25 = 70 |
| B | One blog post, left | 0 |
| C | Pricing page once, then two integration pages | 30 + 10 = 40 |
| D | Pricing page and the careers page | 30 − 20 = 10 |
Visitor A should reach a person within the hour. C is worth a short, relevant follow-up if you know who they are. B needs nothing from sales. D looks like a candidate, not a customer, and a negative weight keeps them out of the queue. A table like this makes the rule visible to the whole team, so people stop arguing about individual leads.
Does the score actually predict wins?
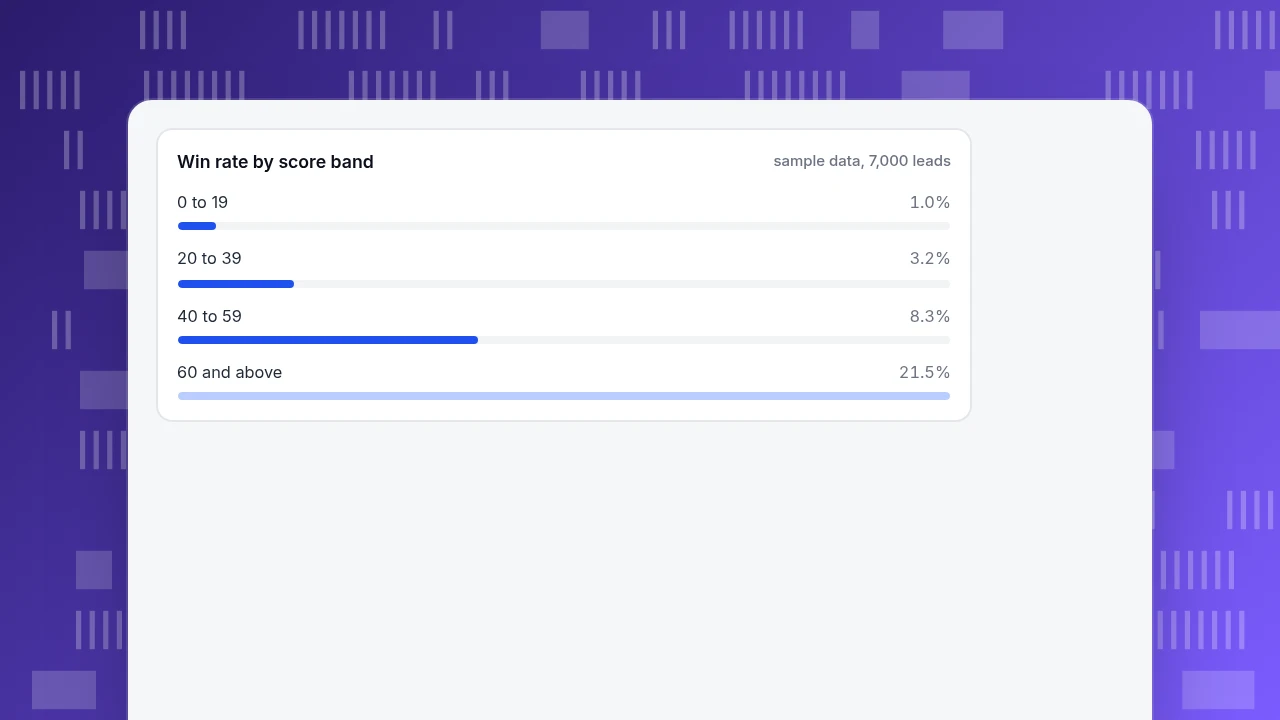
A score is a hypothesis until you test it. Take the leads from a past period, compute each one's score from the signals they showed before they were contacted, and compare outcomes by score band.
Sample data: 7,000 leads in one quarter, of which 204 became customers.
| Score band | Leads | Won | Win rate | Compared with all leads |
|---|---|---|---|---|
| 0 to 19 | 4,200 | 42 | 1.0% | 0.3 times |
| 20 to 39 | 1,900 | 61 | 3.2% | 1.1 times |
| 40 to 59 | 700 | 58 | 8.3% | 2.8 times |
| 60 and above | 200 | 43 | 21.5% | 7.4 times |
| All | 7,000 | 204 | 2.9% | 1.0 times |
The overall win rate is 204 ÷ 7,000 = 2.9%. The top two bands hold 900 leads, 12.9% of the total, but 58 + 43 = 101 wins, 49.5% of all wins, a win rate of 101 ÷ 900 = 11.2%, about 3.9 times the average. That is what a useful score looks like: a small share of leads carries half the wins.
If the table were flat, with similar win rates in every band, the score would be noise and you should change the signals, not the thresholds. Re-run this check each quarter; behaviour drifts.
Win rate by score band
sample data, 7,000 leadsWhat should the routing rule say?
Turn bands into actions with a time limit. A sample rule:
- 60 and above: a salesperson contacts them within one working hour, with a message about the page they read or the question they asked.
- 40 to 59: a salesperson contacts them within one working day, or the lead enters a short sequence.
- 20 to 39: marketing nurture only; no sales time.
- Below 20: no outreach; keep watching.
Check capacity before you commit. In the sample, 900 leads in the two top bands over a quarter is 300 a month, about 15 per working day at 20 working days. If each takes 15 minutes, that is 15 × 0.25 = 3.75 hours of selling time a day, one person's morning. If that is too much, raise the top threshold instead of letting response time slip.
What should the outreach say?
The signal tells you the topic; it does not give you licence to quote someone's browsing history back to them.
- Reference the problem, not the surveillance. "A lot of teams comparing plans ask how billing works with several workspaces" lands better than "I saw you were on our pricing page at 9:42".
- Offer the next useful thing. If the signal was an integration page, offer the integration guide or a short call about that integration.
- Match the channel to the signal. A chat conversation is answered in chat; do not follow it with a cold call to a number you did not ask for.
- Make opting out easy. Under the EU's General Data Protection Regulation, profiling means automated processing of personal data to evaluate personal aspects of a person, and Article 21 gives a person the right to object at any time to processing for direct marketing, including profiling related to it; once they object the data may no longer be processed for that purpose. A score tied to an identified individual is profiling; have a way to honour an objection.
What goes wrong with intent scoring?
- Most visitors are anonymous. You can score someone only if you can reach them. Anonymous visits help you rank pages, not people. Identification happens when a person logs in, fills a form or starts a chat and gives you an email.
- Bots inflate everything. Crawlers visit pricing pages. Remove known bots before scoring, or scores will point at machines.
- A buying group is not one person. A company's signals are spread across several people. Score the account as well as the individual.
- No decay. A pricing visit from six months ago is not intent. Let points expire, for example by counting only the last 30 days.
- Double counting. A signal and the form submit it led to both give points. Score the signals up to the form, then treat the form as the lead event.
- Never testing it. Without the backtest above, the thresholds are folklore.
How to do it with TapCub
Take the sample scoring table. TapCub provides the signals; it is not a CRM and does not score leads or assign them to sales reps, so the score, the routing and the follow-up happen in the tools you already use for that.
- In Web analytics › Goals (or All-platform analytics › Business › Goals), set the pricing page visit and the demo page visit as goals. In Web analytics › Events, record the other signals, such as visits to integration pages, as events.
- Switch on Enable live chat in Live chat › Chat settings › Appearance. Each conversation arrives in Live chat › Inbox with the visitor's source, current page and recent browsing already attached, so a rep sees the signals behind the chat without asking.
- Have people identify themselves: call
tapcub.loginafter they sign in or submit a form. They then appear in All-platform analytics › Users › People with a day-by-day behaviour timeline, and the chat knows who they are. - For B2B, call
tapcub.group('company', 'acme', {...})at login so people from the same company are grouped. All-platform analytics › Users › Accounts shows the account's members and its activity; it is an organisation view, so it does not open individual detail. - In All-platform analytics › Users › Segments & tags, save a rule segment such as "visited pricing at least twice in 7 days", and review its members in the console before you copy them into your CRM. Segments hold identified users only; anonymous visitors have no profile.
- Bots are counted separately from people in TapCub, so crawler visits to the pricing page do not enter the numbers you score from.
For the backtest, export your closed deals with their first-touch signals from the CRM and compare win rates by band, as in the table above.
FAQ
What is intent data in sales?
Evidence of buying interest taken from behaviour: first-party signals from your own website, product and chat, or third-party signals from research activity elsewhere. First-party signals are the easiest to start with, and you can test them against your own closed deals.
How do you use intent data for sales?
Pick a few signals, give each points, test whether the score predicts wins and turn score bands into actions with time limits. In the sample, the top two bands held 12.9% of leads and 49.5% of wins, so those leads get same-hour or same-day outreach.
Which intent signals matter most?
It depends on your business, which is why you test. Pricing and demo page visits, return visits within a week and a chat about buying are common starting points. Give a negative weight to signals like career-page visits.
Is intent data legal to use?
Rules depend on where your contacts are. Under the GDPR, profiling is automated processing of personal data to evaluate personal aspects of a person, and people have the right to object to direct marketing, including related profiling, at any time. Check the rules where you operate and keep a way to honour objections.
How fast should you follow up on an intent signal?
Set a time limit per band and check capacity. In the sample, the top band gets contact within one working hour and the next within a working day, which at 900 leads a quarter is about 15 leads a day, or 3.75 hours of selling time.
Sources
- Gartner. Gartner Sales Survey Finds 61% of B2B Buyers Prefer a Rep-Free Buying Experience (press release, 25 June 2025; 632 buyers surveyed August to September 2024) — 61%, 73% and 69% figures. Checked 2026-11-20.
- European Union. Regulation (EU) 2016/679 (GDPR) — Article 4(4) definition of profiling and Article 21(2)–(3) right to object to direct marketing. Checked 2026-11-20.
Was this article helpful?
We use your answers to fix and expand this page.
Couldn’t send. Please try again in a minute.
Thanks for the feedback. We’ll use it to improve this page.You’ve already sent feedback on this page. Thanks.

Product Adoption Consultant
Explores customer onboarding, live conversations, and self-service, turning common usage questions into practical guidance and improvements.