Try it on your own data
Every report in this article is in the free plan. One snippet for web and apps, up to 10 sites.
Start freeTo interpret t-test results, read the difference first, then its confidence interval, then the p-value; t and the degrees of freedom are only the machinery. In the sample A/B test, a 0.12-page gain has p = 0.0056 and a 95% interval of 0.035 to 0.205: clearly positive but possibly small. Below, every line of the output is recomputed and explained, with a non-significant case and a significant-but-trivial one.
What you will learn
- Read difference, then interval, then p-value; the interval shows how big the effect could be, which p alone cannot
- A non-significant result with a wide interval is inconclusive, not evidence of no effect
- With huge samples a trivial difference gets a tiny p-value; always judge the size against what matters
What is a t-test result actually telling you?
A t-test result tells you whether the gap between two group averages is bigger than you would expect from random variation alone. The null hypothesis it tests is that the two population means are equal. Read the output in this order: the difference (how big), the confidence interval (how sure), the p-value (how surprising under "no difference") and only then the t statistic and degrees of freedom, which are the machinery that produced the other numbers.
Most guides explain the p-value first and the interval last. For decisions it works better the other way round: the difference and its interval answer the question a product or marketing team is really asking, "how much better is it, and how far can I trust that?" The p-value answers a narrower one. If you need the p-value's own definition, the glossary entry on p-value covers it, and the different test types (one-sample, two-sample, paired) are explained in types of t-tests. This page takes one realistic output and reads it line by line.
What does a real t-test output look like?
Sample data: a site tests a new page layout against the old one and compares pages per session. Welch's two-sample t-test (which does not assume equal variances) gives:
Welch two-sample t-test: pages per session
  Control:   n = 4,000   mean = 3.10   sd = 1.90
  Variant:   n = 4,100   mean = 3.22   sd = 2.00
  Difference (variant - control) = 0.12
  Standard error                 = 0.0433
  t                              = 2.769
  degrees of freedom             = 8,092.3
  p-value (two-sided)            = 0.0056
  95% CI for the difference      = [0.035, 0.205]
Every number here is recomputed from the first two lines. The standard error is √(1.90² ÷ 4,000 + 2.00² ÷ 4,100) = √(0.000903 + 0.000976) = 0.0433, and t = 0.12 ÷ 0.0433 = 2.769. The formulas are the ones NIST's Engineering Statistics Handbook gives for the two-sample t-test for equal means, including the Welch-Satterthwaite degrees of freedom.
How do you read each line?
| Line | What it is | Plain-language reading of the sample |
|---|---|---|
| n, mean, sd | Group size, average, spread | Each group has about 4,000 sessions; variant users view 0.12 more pages on average |
| Difference | Variant mean minus control mean | The variant is 0.12 pages higher, a 3.9% relative lift on 3.10 |
| Standard error | Typical sampling noise of the difference | If you reran the test, the difference would typically move by about 0.04 pages |
| t | Difference divided by standard error | The difference is 2.77 standard errors away from zero |
| Degrees of freedom | How much information the test used | 8,092 is close to the total number of sessions, so the t distribution is almost normal |
| p-value | Chance of a gap at least this big if the true means were equal | 0.0056 means a gap this large would turn up in about 1 test in 180 by chance alone |
| 95% CI | Range of differences consistent with the data | The true gain is plausibly anywhere from 0.035 to 0.205 pages |
Two details that trip people up. First, the interval does not contain zero, and that is the same statement as p < 0.05: a 95% interval excludes zero exactly when a two-sided test at the 0.05 level rejects. The interval carries more information, because it shows the size. Second, degrees of freedom in Welch's test is usually not a whole number. NIST's own example gives T = −12.62 with 326 degrees of freedom and a critical value of 1.9673 for a 0.05 two-sided test; with 8,092 degrees of freedom the critical value is 1.9603, which is why the interval above uses 1.960 × 0.0433 = 0.085 either side of 0.12.
| Output line | What it answers |
|---|---|
| Difference | How big is the gap? |
| 95% confidence interval | Which gaps fit the data? |
| p-value | How surprising is this if the means were equal? |
| t and degrees of freedom | What produced the p-value and the interval? |
Read from the top down; the last row is machinery.
How do you decide what the result means?
Work through four questions, in this order:
- Is the interval entirely above (or below) zero? If yes, the direction is clear. Here, 0.035 to 0.205 is above zero.
- Is the whole interval worth acting on? Decide beforehand the smallest gain that matters, for example 0.10 pages. Here, the low end (0.035) is below it, so you cannot rule out a gain smaller than you care about, even though the result is significant.
- How was the test run? A fixed sample size decided in advance, one primary metric and one look at the result are the conditions the p-value assumes.
- Does it make sense? A 3.9% rise in pages per session is believable for a layout change. A 40% rise from a colour change would call for checking for a bug.
The sample passes the first test, partly passes the second, and needs a decision about the third. That is a more useful conclusion than "significant".
What do significant, non-significant and tiny results look like?
Three runs of the same kind of test show how the pieces move. All are sample data, recomputed with Welch's method.
| Case | Groups | Difference | t | df | p | 95% CI | Effect size (d) |
|---|---|---|---|---|---|---|---|
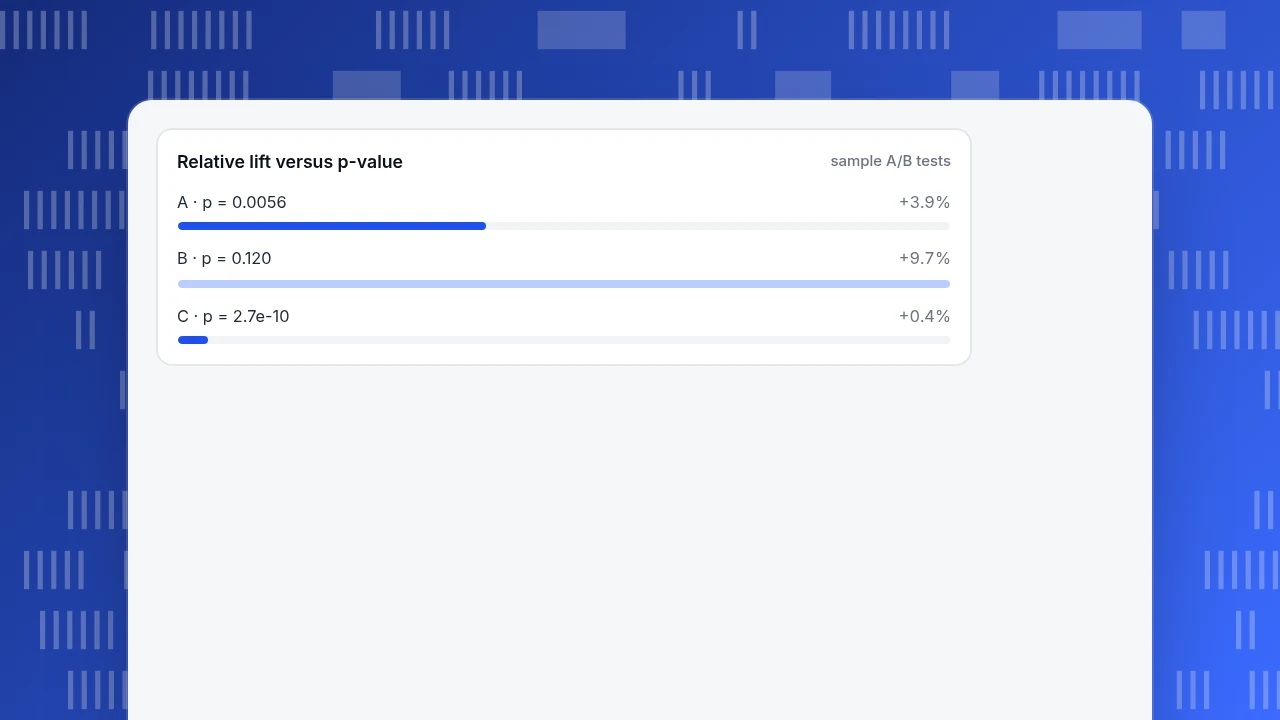
| A: moderate sample | 4,000 and 4,100 sessions, 3.10 vs 3.22 | 0.12 | 2.77 | 8,092 | 0.0056 | 0.035 to 0.205 | 0.06 |
| B: small sample | 200 and 210 sessions, 3.10 vs 3.40 | 0.30 | 1.56 | 408 | 0.120 | −0.079 to 0.679 | 0.15 |
| C: huge sample | 2,000,000 each, 3.100 vs 3.112 | 0.012 | 6.32 | 3,999,998 | 2.7 × 10⁻¹⁰ | 0.0083 to 0.0157 | 0.006 |
The effect size here is the difference divided by the pooled standard deviation (Cohen's d).
- Case B is not "no effect". The difference (0.30) is bigger than in A, but the interval runs from −0.079 to 0.679, so the data fit anything from a small loss to a large gain. It is inconclusive, not negative.
- Case C is "significant" and nearly useless. With two million sessions a group, a 0.012-page difference (0.4%) gets a p-value around 10⁻¹⁰. The interval shows the whole range is under 0.016 pages. Statistical significance and practical importance are different things.
Relative lift versus p-value
sample A/B testsWhat does the p-value not tell you?
The American Statistical Association's 2016 statement on p-values lists six principles. Three matter for reading a t-test:
- A p-value does not measure the probability that the hypothesis you studied is true, or that the data were produced by random chance alone. A p of 0.0056 does not mean there is a 0.56% chance that the layout has no effect.
- A p-value, or statistical significance, does not measure the size of an effect or the importance of a result. Case C shows this directly.
- By itself, a p-value does not provide a good measure of evidence regarding a model or hypothesis, and conclusions should not rest only on whether a p-value crosses a threshold.
So report the difference and the interval with the p-value, never the p-value alone, and say what the test was.
Which t-test should you have used?
The output above is a two-sample test on independent groups, using Welch's version. Check three things before you trust any t-test result:
- Independent or paired? If the same users appear in both groups (before and after), use a paired test; an independent test on paired data gives the wrong standard error.
- Equal variances? The equal-variance version pools the standard deviations and uses N1 + N2 − 2 degrees of freedom. Welch's version does not need that assumption, and NIST describes it as robust to unequal sample sizes and variances. When in doubt, use Welch.
- One tail or two? Decide before looking. A two-sided test asks whether the means differ in either direction, and is the safe default.
When can a t-test mislead you?
- Skewed metrics. Revenue per visitor has many zeros and a few large values. With large samples the t-test is usually still reasonable, but with small ones the average can swing on a single outlier. Check the distribution, and consider a transformation or a different test.
- Repeated users. If one person contributes many sessions, sessions are not independent. Analyse per user.
- Peeking. Checking the p-value every day and stopping when it dips below 0.05 raises the false-positive rate well above 5%. Fix the sample size or the stopping rule in advance.
- Many metrics. Test twenty metrics at the 0.05 level and about one will look significant by chance. Pick one primary metric.
- A change of definition. If "session" was redefined partway through, the groups are not comparable.
How to do it with TapCub
TapCub does not run t-tests or split traffic for experiments; it provides the group numbers that go into the test. For the layout example:
- In All-platform analytics › Behavior › Behavior analysis, open the distribution view with pages per session as the subject. You get a histogram with the mean and median for the period, so you can see the skew before you test anything.
- Run the experiment itself in your own tool, and send an event or property that records which layout each visitor saw. TapCub does not assign visitors to variants.
- In All-platform analytics › Behavior › Metrics & SQL, open the SQL tab (the SQL playground) and query the event data to return, for each variant, the number of sessions and the average pages per session. The standard deviation is the third number each group needs: compute it in the query if your SQL supports it, or export the rows from All-platform analytics › Data › Data export and calculate it outside.
- Put the numbers into any statistics tool or the formulas above. TapCub reports the means and counts; the p-value is computed outside it.
- Mark the start and end of the test in Configuration › Annotations, so a later reader knows which dates the groups cover.
FAQ
How do you interpret t-test results?
Read the difference first, then its confidence interval, then the p-value. If the 95% interval excludes zero the result is significant at 0.05, and the interval also shows how large the effect could be. In the sample, 0.12 pages with a 0.035 to 0.205 interval is clearly positive but possibly small.
What does a p-value of 0.05 mean in a t-test?
It means that if the two population means were equal, a gap at least this large would appear in about 5% of tests. It is not the probability that the null hypothesis is true, and it says nothing about the size of the effect.
What is a good t-value?
There is no good t on its own. What matters is t relative to the critical value for your degrees of freedom: about 1.96 for a 0.05 two-sided test with large samples, and 1.9673 in NIST's example with 326 degrees of freedom. A larger absolute t means a smaller p-value.
What do degrees of freedom mean in a t-test?
They set the shape of the t distribution, which depends on how much data you have. With equal variances assumed, they are N1 + N2 − 2. Welch's test computes a fractional value from the sample variances and sizes, which is why you see numbers like 8,092.3.
Can a result be significant but not important?
Yes. In case C, two million sessions per group make a 0.012-page difference highly significant (p about 2.7 × 10⁻¹⁰) even though the whole interval is below 0.016 pages. Always look at the size of the difference, not only the p-value.
Sources
- NIST/SEMATECH. Two-sample t-test for equal means, e-Handbook of Statistical Methods — test statistics, Welch-Satterthwaite degrees of freedom, critical region and the T = −12.62, ν = 326 example. Checked 2026-11-20.
- American Statistical Association. Statement on Statistical Significance and P-Values (press release, 7 March 2016) — the six principles; full statement by Wasserstein and Lazar, The American Statistician. Checked 2026-11-20.
Was this article helpful?
We use your answers to fix and expand this page.
Couldn’t send. Please try again in a minute.
Thanks for the feedback. We’ll use it to improve this page.You’ve already sent feedback on this page. Thanks.

Data Engineer
Writes about event design, data quality, and collection workflows, with verifiable implementation methods for reliable analytics.