Try it on your own data
Every report in this article is in the free plan. One snippet for web and apps, up to 10 sites.
Start freeThe three types of t-tests are the one-sample test (a mean against a fixed number), the independent two-sample test (two separate groups) and the paired test (the same units measured twice). Choose by how the data was collected, because the wrong design changes the result far more than the significance level does. In the worked example below, identical data gives t = 4.00 with the paired test and t = 1.03 with the independent one.
What you will learn
- Choose by data design: one group vs a number, two separate groups, or the same units twice
- Use Welch's version of the independent test unless you have a reason to assume equal variances
- The wrong test can flip a verdict: the same data gave t = 4.00 paired and t = 1.03 independent
The three t-tests at a glance
All three t-tests compare means and rely on the same t distribution. They differ in what the data looks like and therefore in what the standard error is built from. Pick by looking at how the numbers were collected, not by which test sounds familiar.
| One-sample | Independent two-sample | Paired | |
|---|---|---|---|
| Question | Is this group's mean different from a fixed number? | Do two separate groups have different means? | Did the same units change between two measurements? |
| Data shape | One column of values plus a target | Two columns, unrelated units | Two columns, each row is the same unit |
| What gets tested | mean − target | mean A − mean B | mean of the row-by-row differences |
| Degrees of freedom | n − 1 | Student: n₁ + n₂ − 2; Welch: estimated | n − 1 (n = number of pairs) |
| Typical analytics case | Is median checkout load time still above the 2.5 s target? | Do email buyers spend more per order than search buyers? | Did bounce rate fall on the same pages after a redesign? |
Two related tests sometimes get listed as separate "types": Student's t-test is the independent test that assumes both groups have the same variance, and Welch's t-test is the independent test that does not. They are variants of the middle column, covered in its own section below. The definition of the test itself lives in the t-test glossary entry; this guide is only about choosing among them.
How do I choose between them?
Ask three questions in order. The first one that fits settles the choice.
- Is there one group and a number it should be compared with? Use the one-sample test. The "number" must come from outside your data: a target, a published benchmark, a contractual limit. A mean from last month's data is another sample, not a fixed number.
- Is every row in one column linked to exactly one row in the other? Same visitors measured before and after, same pages before and after, matched pairs. Use the paired test.
- Otherwise the groups are separate units, so use the independent test, and default to Welch's version unless you have a reason to believe the variances are equal.
A quick check for question 2: delete the sort order. If you could shuffle one column and still have a meaningful dataset, the groups are independent. If shuffling would destroy the link between rows, they are paired.
A rule of thumb for a gray zone: two groups of different sizes can never be paired, because pairs need the same number of rows on both sides. Two groups of the same size are not automatically paired; the link must exist in how the data was collected.
| Your data | Test | Check first |
|---|---|---|
| One column and an external target | One-sample t-test | Target does not come from your own data |
| Two columns, unrelated units | Independent t-test (Welch) | Group spreads; sample sizes |
| Two columns, each row is the same unit | Paired t-test | Differences look roughly normal |
| Yes / no outcomes per visitor | Test of proportions, not a t-test | Counts in each cell |
If you could shuffle one column without losing meaning, the groups are independent.
One-sample t-test: is the mean different from a target?
Sample data: a store sets a target of 2.5 seconds for the checkout page. Over 10 days, the daily median load time (in seconds) was 2.9, 2.6, 3.1, 2.8, 2.7, 3.0, 2.5, 2.9, 3.2, 2.8.
- Mean x̄ = 28.5 ÷ 10 = 2.85 s
- Sample standard deviation s = 0.217
- Standard error = s ÷ √n = 0.217 ÷ √10 = 0.0687
- t = (x̄ − 2.5) ÷ standard error = 0.35 ÷ 0.0687 = 5.09, with n − 1 = 9 degrees of freedom
- Two-sided p ≈ 0.0007; the 95% confidence interval for the mean is 2.69 to 3.01 s
The interval does not contain 2.5, which agrees with the small p-value. Both say the same thing: the checkout page's typical load time is above target, by about 0.35 s. How to read that p-value and what it does not say is covered in how to interpret a p-value.
When this test fits: a single metric against a target, an SLA, or a benchmark published by someone else. When it does not: comparing this month with last month. That is two samples, so use the independent test, or the paired test if the same units appear in both.
Independent two-sample t-test: Student vs Welch
Sample data: average order value in dollars, for 10 orders that came from an email campaign and 11 that came from search.
- Email: 48, 52, 61, 45, 70, 55, 58, 49, 66, 53 → mean 55.70, standard deviation 8.06
- Search: 41, 47, 39, 52, 44, 50, 38, 46, 43, 45, 42 → mean 44.27, standard deviation 4.34
- Difference in means = 55.70 − 44.27 = 11.43
The standard deviations differ by almost a factor of two, so the equal-variance assumption is doubtful. Welch's test gives the standard error as √(s₁²/n₁ + s₂²/n₂):
- Standard error = √(8.06²/10 + 4.34²/11) = √(6.50 + 1.71) = 2.86
- t = 11.43 ÷ 2.86 = 3.99, with Welch–Satterthwaite degrees of freedom ≈ 13.5
- Two-sided p ≈ 0.0014; 95% confidence interval for the difference: 5.3 to 17.6 dollars
Student's version pools the two variances and assumes they are equal. On the same data it gives t = 4.10, 19 degrees of freedom and p ≈ 0.0006. The answer is similar here because the groups are close in size; when group sizes differ a lot and the smaller group has the larger variance, the two versions can disagree noticeably. Welch's test costs very little when variances are equal and protects you when they are not, which is why many statistics packages use it as the default for two samples. SciPy documents it as equal_var=False on ttest_ind.
Only 10 and 11 orders are used here to keep the arithmetic checkable. Real order values are skewed to the right, so with a small sample you would also look at the data, not only at t. More on that in the assumptions section.
Paired t-test: the same units, measured twice
Sample data: bounce rate (%) on 8 landing pages, before and after a redesign.
| Page | Before | After | Difference |
|---|---|---|---|
| 1 | 62 | 57 | 5 |
| 2 | 55 | 53 | 2 |
| 3 | 71 | 64 | 7 |
| 4 | 48 | 47 | 1 |
| 5 | 66 | 60 | 6 |
| 6 | 59 | 58 | 1 |
| 7 | 73 | 65 | 8 |
| 8 | 52 | 50 | 2 |
- Mean difference d̄ = 32 ÷ 8 = 4.0 points
- Standard deviation of the differences = 2.83
- Standard error = 2.83 ÷ √8 = 1.00
- t = 4.0 ÷ 1.00 = 4.00, with 8 − 1 = 7 degrees of freedom
- Two-sided p ≈ 0.0052; 95% confidence interval for the mean drop: 1.6 to 6.4 points
All eight pages improved. The paired test sees that, because it works on the eight differences and ignores how different the pages were from each other at the start. Page 7 started at 73% and page 4 at 48%; that spread is irrelevant to the question "did the redesign change anything".
What happens when you choose the wrong test?
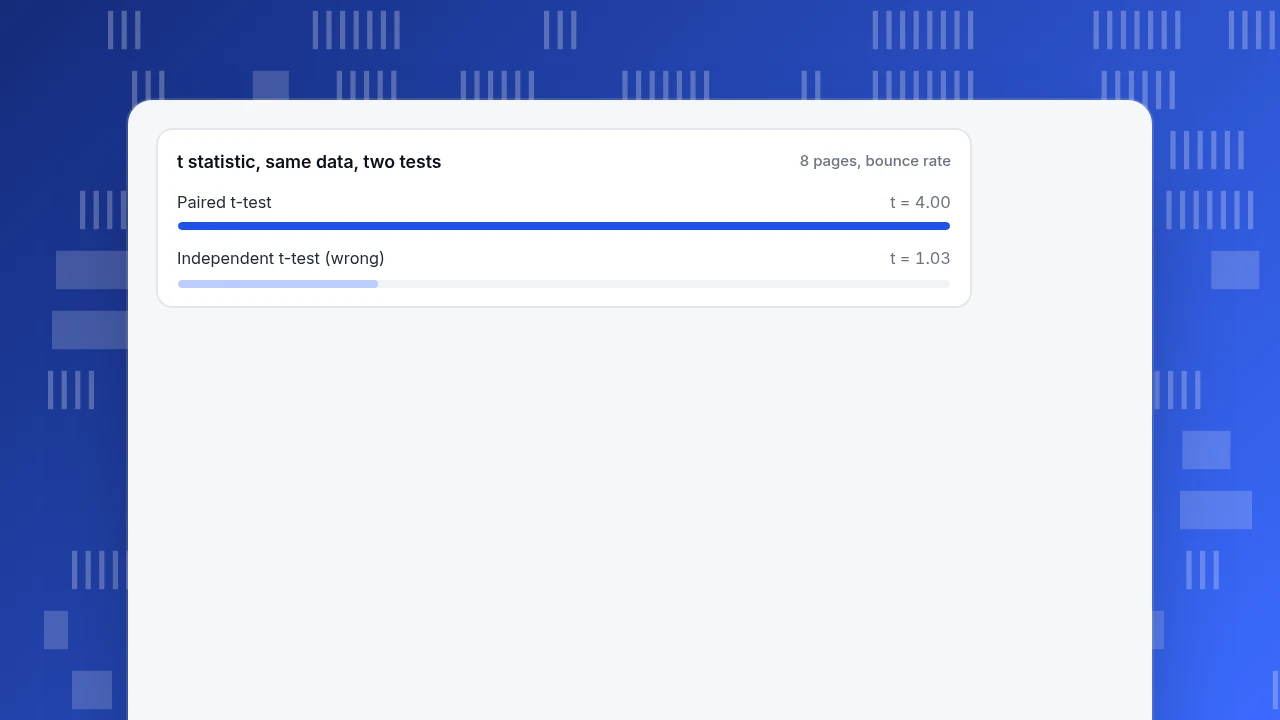
Run the same bounce-rate data through the independent test by mistake. The before column has mean 60.75, the after column 56.75, a gap of 4.0 points. That sounds the same, but the standard error is now built from the spread between pages:
- Standard error = √(8.94²/8 + 6.41²/8) = 3.89
- t = 4.0 ÷ 3.89 = 1.03, with about 12.7 degrees of freedom
- Two-sided p ≈ 0.32
Same data, same 4.0-point gap, and the verdict flips from "clear improvement" to "no evidence". The independent test lets the large differences between pages swamp the signal. The mistake in the other direction is just as real: running a paired test on independent groups pretends rows are linked when they are not, and it has no meaningful pairing to take advantage of.
This is the reason the choice matters more than the significance level. Moving the threshold from 0.05 to 0.01 changes which verdict you reach for a borderline result. Choosing the wrong design changes the answer by a factor of four in t. For how the threshold itself is set and what it means, see statistical significance.
t statistic, same data, two tests
8 pages, bounce rateWhat do the t-tests assume?
Every t-test has the same short list. Check each before trusting a p-value.
| Assumption | What it means | How to check | If it fails |
|---|---|---|---|
| Independence | Observations in a sample do not influence each other (for paired: pairs are independent of other pairs) | Think about how the data was collected: repeated visitors, same customer in two rows | Aggregate to one row per person or per unit before testing |
| Roughly normal means | The sampling distribution of the mean is close to normal | Histogram or Q-Q plot; with n above about 30 per group the mean is usually well behaved | Use more data, a transformation (for example log of order values), or a rank-based test |
| Equal variance (Student only) | Both groups spread equally | Compare standard deviations; the ratio above about 2 is a warning sign | Use Welch's test |
| No extreme outliers | A few wild values do not drive the mean | Sort the data and look at the top and bottom | Investigate the values first; do not delete them to get a result |
| Continuous measurement | Values are numbers where averages make sense | Look at the metric | For yes/no outcomes such as converted or not, a test on proportions fits better, for example the chi-square test |
For paired data, the normality assumption applies to the differences, not to the two raw columns.
One-sided or two-sided?
A two-sided test asks "is there a difference in either direction", and the p-values in this article are two-sided. A one-sided test asks "is it specifically greater" or "specifically smaller", and halves the p-value when the data points the predicted way.
- Choose the direction before seeing the data, and write it down.
- If an effect in the opposite direction would still cause you to act, use two-sided.
- Never switch to one-sided after a two-sided test came out at 0.07. That is the same as doubling your significance level without saying so.
In the bounce-rate example, a redesign that made pages worse would matter as much as one that made them better, so two-sided is the honest choice.
How should I report the result?
A p-value alone says whether the data is surprising under no effect. It does not say how big the effect is. Report four things, in this order:
- The size of the difference in the metric's own units: "bounce rate fell 4.0 points".
- The 95% confidence interval: "1.6 to 6.4 points".
- The test used and why: "paired t-test, the same 8 pages before and after".
- The p-value: "p ≈ 0.005".
An interval from 1.6 to 6.4 tells a reader that the drop is real, and it also tells them it might be small enough not to matter commercially. For standardized effect sizes see effect size, and for how the interval is built see how to calculate a confidence interval.
Common mistakes with t-tests
- Using the independent test on before-and-after data from the same units. Shown above: t of 1.03 instead of 4.00.
- Treating many page views as many observations. If one visitor produces 5 rows, you have 1 observation with 5 correlated values. Aggregate per visitor first.
- Running many t-tests and reporting the one that worked. Testing 20 segments at the 0.05 level yields about one false positive by chance alone (20 × 0.05 = 1). Decide which comparisons you will make before looking.
- Using t-tests for rates with tiny counts. A 2% conversion rate on 40 visitors is one conversion in a small group; a test of proportions is the right tool.
- Confusing "not significant" with "no difference". A small sample can easily fail to detect a real effect. Look at the interval: a wide one means the answer is "we do not know yet".
- Picking one-sided after peeking. Described in the previous section.
For the wider topic of how tests turn into decisions, see hypothesis testing.
How to use TapCub data for a t-test
TapCub does not run t-tests. It does not calculate p-values or confidence intervals. What it provides is the data to test and the context to design the comparison correctly. Take the checkout-page example above.
- Collect the metric. Real-user page performance is in Monitoring › Performance. For the 10 daily values used in the one-sample example, read the checkout page's daily values for the load metric you track there.
- Get row-level data when you need it. For the independent and paired designs you need one value per order or per page. Use All-platform analytics › Behavior › Metrics & SQL to query events, or the asynchronous export under All-platform analytics › Data › Data export for raw detail. Raw detail older than the retention period has already been deleted, so export before you need it.
- Mark the change. Add a date annotation under Configuration › Annotations for the redesign or campaign launch, so the before and after periods are not guessed later.
- Choose the design. Same pages before and after means a paired test; orders from two different campaigns means independent. Decide this before running anything.
- Run the test outside TapCub in a spreadsheet or in Python, and record the effect size and interval next to the annotation.
TapCub's job ends at the numbers. The test, and the decision, are yours.
FAQ
What are the three types of t-tests?
The one-sample t-test compares a group's mean with a fixed value. The independent two-sample t-test compares the means of two unrelated groups. The paired t-test compares two measurements on the same units by testing the mean of their differences. Student's and Welch's versions are two ways of running the independent test.
What is the difference between Student's t-test and Welch's t-test?
Both compare two independent groups. Student's pools the variances and assumes they are equal, with n₁ + n₂ − 2 degrees of freedom. Welch's keeps the variances separate and estimates the degrees of freedom. Welch's is the safer default because it costs little when variances are equal and protects when they are not.
When should I use a paired t-test instead of an independent one?
Use paired when each row in one group is linked to one row in the other: the same visitors or pages measured twice, or deliberately matched pairs. If you could shuffle one column without losing meaning, the groups are independent. Paired designs usually have more power because they remove differences between units.
Can I use a t-test with a small sample?
Yes, the t distribution was designed for small samples, but the data must be roughly normal because there is not enough data for averaging to rescue a skewed distribution. With under about 15 observations, look at a plot and treat the result cautiously. A wide confidence interval is the honest message.
Is a t-test one-tailed or two-tailed?
It can be either. A two-tailed test detects a difference in both directions and is the default. A one-tailed test only looks in one pre-chosen direction and halves the p-value. Choose the direction before collecting or seeing data, never after a two-tailed result came out borderline.
See also: How to Interpret T-Test Results: Annotated Output.
Sources
- NIST/SEMATECH e-Handbook of Statistical Methods. Two-sample t-test for equal means — test statistic, pooled and unequal-variance forms, degrees of freedom. Checked 2026-11-19.
- NIST/SEMATECH e-Handbook of Statistical Methods. Paired comparisons — why pairing removes between-unit variation. Checked 2026-11-19.
- SciPy documentation. scipy.stats.ttest_ind — the
equal_varparameter for Student's and Welch's variants. Checked 2026-11-19. - SciPy documentation. scipy.stats.ttest_rel — paired-samples t-test. Checked 2026-11-19.
Was this article helpful?
We use your answers to fix and expand this page.
Couldn’t send. Please try again in a minute.
Thanks for the feedback. We’ll use it to improve this page.You’ve already sent feedback on this page. Thanks.

Technical Engineer
Focuses on tracking code, SDKs, and API integrations, with practical guidance on implementation checks and troubleshooting.