Try it on your own data
Every report in this article is in the free plan. One snippet for web and apps, up to 10 sites.
Start freeA TV dashboard is a wall screen that tells anyone who looks up, from across the room, whether something needs attention and where. That means about five large numbers, a written rule behind every colour, a status word beside each number and a visible timestamp. Below: the five-second test, a layout, threshold rules with a worked board and how to keep the screen trustworthy.
What you will learn
- Show one headline plus four or five numbers, each with an owner who would act if it turned red
- Define OK, Watch and Act by rules anyone can recompute against the normal for that time, and add a status word so colour is never the only signal
- Print a data-as-of time and add a no-data alert; a frozen screen looks calm, which is the worst failure
What makes a TV dashboard different from a normal dashboard?
A normal dashboard is used: someone sits close, changes the date range, clicks a card and digs in. A TV dashboard is only glanced at, from across a room, for two or three seconds, by people who are busy with something else. Nobody can click, hover or scroll. That changes what the screen is for.
A wall screen has one job: tell anyone who looks up whether something needs attention, and where. Everything else belongs on a normal dashboard. The test is the five-second test: show the screen to a colleague for five seconds, turn it off, and ask two questions. Is anything wrong? What is it? If they cannot answer both, the board is a poster, not a tool.
Three consequences shape the rest of this guide:
- Fewer numbers. Each extra number competes for the same glance.
- Meaning built in. The screen has to say "fine" or "act" itself, because nobody can open a tooltip.
- Proof it is alive. A frozen screen looks calm, which is the worst failure for a board whose job is to flag trouble.
The metrics themselves, and how to pick them, are covered in analytics dashboard, KPI dashboard and business dashboard. This article is about turning a small set of them into a screen that works from the back of the room.
How many numbers belong on a wall screen?
Start from the decision, not the data. For each number, ask what someone would do if it turned red. A number with no action behind it is decoration.
| Rule | Why | Example |
|---|---|---|
| One headline number, large | Gives the room a single anchor | Orders so far today |
| Four to five supporting numbers | Enough to explain the headline, few enough to scan in seconds | Visitors, signup rate, checkout errors, page speed |
| Each number answers a question a team can act on | Prevents vanity totals | "Are errors up?" rather than "total pageviews ever" |
| One owner per number | Someone responds when it turns red | Checkout errors belong to engineering |
| Nothing that needs a legend or a filter | Nobody can click | Fixed time window, written on the card |
Five or six numbers is a working rule of thumb, not a standard: it is about the number of items a person can take in during one glance. If your team insists on ten, split into two boards that rotate, or keep the second for a normal dashboard on someone's desk. A guide to picking one top-level number is in north star metric.
How do you lay out one screen?
Match the layout to the screen's shape, not to your laptop's. A wall TV is usually 16:9. Dashboard tools that offer a TV mode, such as Datadog's, scale the board to fit the screen and recommend designing the dashboard with an aspect ratio close to the TV's, because a mismatch leaves empty space at the edges and makes widgets look zoomed out.
Sample layout for a 1920 × 1080 screen with one headline and four supporting numbers:
| Zone | Size (pixels) | Content |
|---|---|---|
| Left half | 960 × 1080 | Headline number, very large, with the same time yesterday beside it |
| Top-right left | 480 × 540 | Supporting number 1 with status word |
| Top-right right | 480 × 540 | Supporting number 2 with status word |
| Bottom-right left | 480 × 540 | Supporting number 3 with status word |
| Bottom-right right | 480 × 540 | Supporting number 4 with status word |
| Thin strip along the bottom | full width, a few dozen pixels | "Data as of 14:02" and the time window |
Four rules for the card itself:
- The number is the largest thing on it. Label small, value huge, change next to it.
- Put the status next to the number, in words. "Act", "Watch" or "OK", not only a colour.
- Compare with normal, not with zero. A card that says 850 means nothing; "850 vs 1,000 normal" does.
- Avoid decoration. Gradients, shadows and animation cost legibility at a distance and add nothing.
Check your layout the way the room will see it: put it on the real screen and walk to the farthest desk. If you cannot read the headline and tell the status words apart from there, increase the size or remove a number. There is no formula that beats that test, because room size, screen size and eyesight vary.
How should colour and thresholds work?
Colour carries the verdict, so it has to be defined in advance. Use three states at most. Define each state by a rule that anyone can recompute, and compare against what is normal for that time, not against a daily average.
Rules for the sample board below:
- Higher-is-better numbers (visitors, orders, signup rate): OK at 90% or more of normal; Watch from 70% to under 90%; Act below 70%.
- Lower-is-better numbers (error rate): OK at up to 1.5 times normal; Watch above 1.5 and up to 2 times; Act above 2 times.
- Page speed: use the published Core Web Vitals bands. Largest contentful paint is good at 2.5 seconds or less, and the pass mark is assessed at the 75th percentile of page loads. Treat 2.5 to 4 seconds as Watch and above 4 seconds as Act.
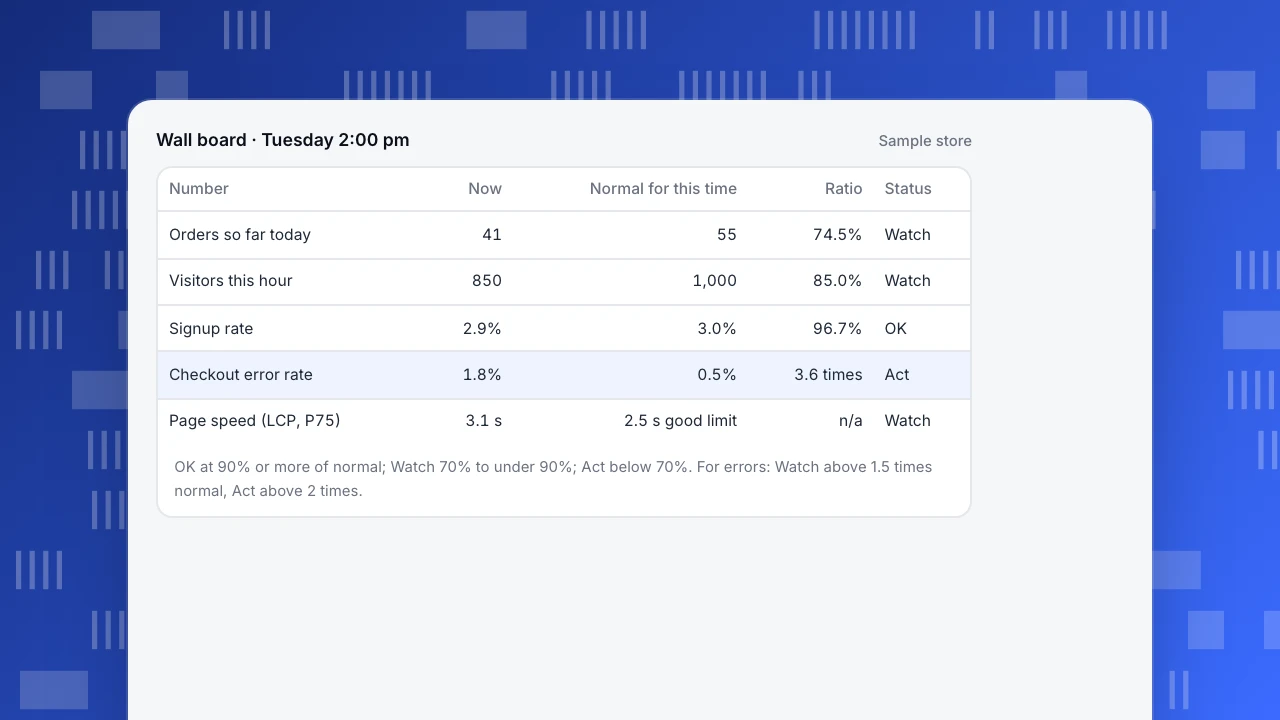
Sample data: a store's wall board at 2:00 pm on a Tuesday.
| Number | Now | Normal for this time | Ratio | Status |
|---|---|---|---|---|
| Orders so far today | 41 | 55 | 74.5% | Watch |
| Visitors this hour | 850 | 1,000 | 85.0% | Watch |
| Signup rate | 2.9% | 3.0% | 96.7% | OK |
| Checkout error rate | 1.8% | 0.5% | 3.6 times | Act |
| Page speed (LCP, P75) | 3.1 s | 2.5 s good limit | n/a | Watch |
Read it the way the room would. Orders are at 74.5% of normal: 41 ÷ 55. Visitors are at 85%: 850 ÷ 1,000, so traffic explains only a little of it. Signup rate is fine at 96.7% of normal. Checkout errors are 1.8% against 0.5% normal, which is 3.6 times and crosses the Act line. The red card points at where to look, and the headline's amber says why it matters.
Three more rules keep colour honest:
- Never use colour alone. The WCAG success criterion on use of colour says colour must not be the only way to convey information, because many people cannot tell green from red. The status word does that job.
- Check contrast. WCAG asks at least 4.5 to 1 for normal text and 3 to 1 for large text. On a TV, treat all your text as needing the higher bar; glare and distance take contrast away.
- Tune thresholds against history. If red shows up on 20 of the last 30 days, people stop looking. Replay the rule against the last month and loosen it until red means something.
What should you leave off the screen?
The hard part of a wall board is what stays out. Leave out:
- Tables and long lists. They need reading, which a glance cannot do.
- Filters and date pickers. Nobody can use them; fix the window and write it on the card.
- Cumulative totals that only grow. They are always green and never prompt action.
- Anything with a person's name, email or address. A screen in a shared office or a reception area is visible to visitors. Show counts and rates, not people.
- Metrics nobody owns. If no team would respond, remove it.
- More than one screen of content. Rotating through slides means a problem on slide four is invisible for most of the cycle.
Put the detail one click away, on a normal dashboard, and let the wall number link in people's heads to where they go next. Choose the five numbers at the weekly meeting, not on the TV.
How do you keep the screen trustworthy?
A wall screen fails quietly. The browser freezes, a login expires, the data feed stops, and the board keeps showing the last good numbers in calm green. Build in three defences:
- Print a timestamp. "Data as of 14:02" along the bottom. If it is more than a few minutes old, everyone can see the board is stale.
- Add a no-data alert. Alert when no events have arrived for a set number of minutes, so a broken feed reaches a person's phone and not just the wall.
- Do not rely on the wall for the urgent. For anything where minutes matter, send an alert to a channel people read. The wall is for ambient awareness, the alert is for response.
Also decide who owns the screen. Somebody must restart the browser, rotate the login and update the numbers when priorities change. Without an owner, the board decays within a quarter.
Common mistakes with TV dashboards
- Shrinking a desktop dashboard onto a TV. Details that work close up disappear at distance; build a TV version with fewer, larger cards.
- Ten numbers, all the same size. With no hierarchy the eye has nowhere to start.
- Green, amber and red with no rule behind them. If people cannot say what turns a card red, they will not trust it.
- Thresholds based on a daily average. Traffic at 3 am is always "below average"; compare with the same time on the same weekday.
- Colour as the only signal. Fails for colour-blind viewers and washed-out screens.
- A frozen screen no one notices. Always show when the data was last updated.
How to build the wall board in TapCub
Take the board above: five numbers, three states, a timestamp. TapCub does not document a dedicated TV or kiosk mode for dashboards, so you build the board as a normal dashboard and use the browser's full-screen view on the TV; check on the real screen that it is readable. Here is the path:
- Save the numbers. In All-platform analytics › Behavior › Event analysis (or Behavior analysis), build each number, such as orders or checkout errors, and save it. In All-platform analytics › Behavior › Metrics & SQL you can define a rate once and reuse it.
- Compose the board. In All-platform analytics › Overview › My dashboards, create a dashboard. A card can be a saved analysis, a text block or a divider. Use a text card for the status rules and the time window. The board has its own date and filters, so fix the date window there.
- Show it on the wall. Open the dashboard in a browser on the TV. If the screen cannot hold a login, a dashboard share link is read-only and the password may be left empty, but anyone with the link can see it, shared pages show at most the last 90 days, and the link only opens filters on the project's share allowlist. Add a password if the room is not private. For live app numbers, the app realtime page refreshes about every 10 seconds; the docs do not state a refresh interval for saved dashboards, so confirm on your screen how current the cards are.
- Add the alerts the wall cannot give. In All-platform analytics › Operations › Monitors, add a rule for each red line: for example the built-in error rate with a fixed threshold, or a period-change rule. Use the forecast or anomaly condition for numbers with a daily rhythm, because they compare with the same weekday. Run a dry run first: it reports how many times the last 30 days would have fired, which is the history check described above. A collection-gap rule fires when no data arrives for a set number of minutes, which covers the frozen-feed case.
- Deliver the summary. In Configuration › Settings › Notifications, scheduled daily, weekly or monthly reports go to your channels (webhook, WeCom, DingTalk, Feishu or email) if your plan includes them. They carry visitors, pageviews, sessions, goal conversions and a short reading to people who are not in the room.
TapCub's monitors only notify; they do not act on the alert for you, and the platform does not decide your thresholds. For the monitor concept in general, see monitor.
FAQ
What is a TV dashboard?
A TV dashboard is a dashboard shown on a wall-mounted or standing screen so a team can see key numbers without opening anything. It is read from a distance in a few seconds, so it shows only a handful of large numbers with clear status, and leaves exploration to a normal dashboard.
How many metrics should a TV dashboard show?
About five or six: one headline and four or five supporting numbers. This is a rule of thumb for what a person takes in at a glance, not a standard. If more are needed, build a second board rather than shrinking text on the first.
What colours should a TV dashboard use?
Three states at most, each defined by a written rule, plus a text label so colour is never the only signal. WCAG asks colour not to be the only means of conveying information and sets 4.5 to 1 contrast for normal text. Test on the real screen from the back of the room.
How often should a TV dashboard refresh?
Often enough that the numbers are current for the decision the screen supports. For traffic, every few seconds to a minute is plenty. For daily revenue, hourly is enough. Whatever you pick, print "data as of" on the screen so a stale feed is obvious.
Should the TV dashboard be public?
Not by default. A screen in a shared space is seen by visitors, so show counts and rates, never names or emails. If you use a share link to run the screen, protect it with a password, and remember anyone with the link can open it.
Sources
Was this article helpful?
We use your answers to fix and expand this page.
Couldn’t send. Please try again in a minute.
Thanks for the feedback. We’ll use it to improve this page.You’ve already sent feedback on this page. Thanks.

Data Engineer
Writes about event design, data quality, and collection workflows, with verifiable implementation methods for reliable analytics.