Try it on your own data
Every report in this article is in the free plan. One snippet for web and apps, up to 10 sites.
Start freeA p-value is the chance of seeing a gap at least as large as yours if there were really no difference, not the chance your result is true. In the 4.0% vs 4.8% example below, p = 0.168 and the interval runs from −0.34 to +1.94 points. Read the p-value with the gap and the interval, never alone.
What you will learn
- The p-value assumes there is no difference; it cannot tell you how likely it is that there is none
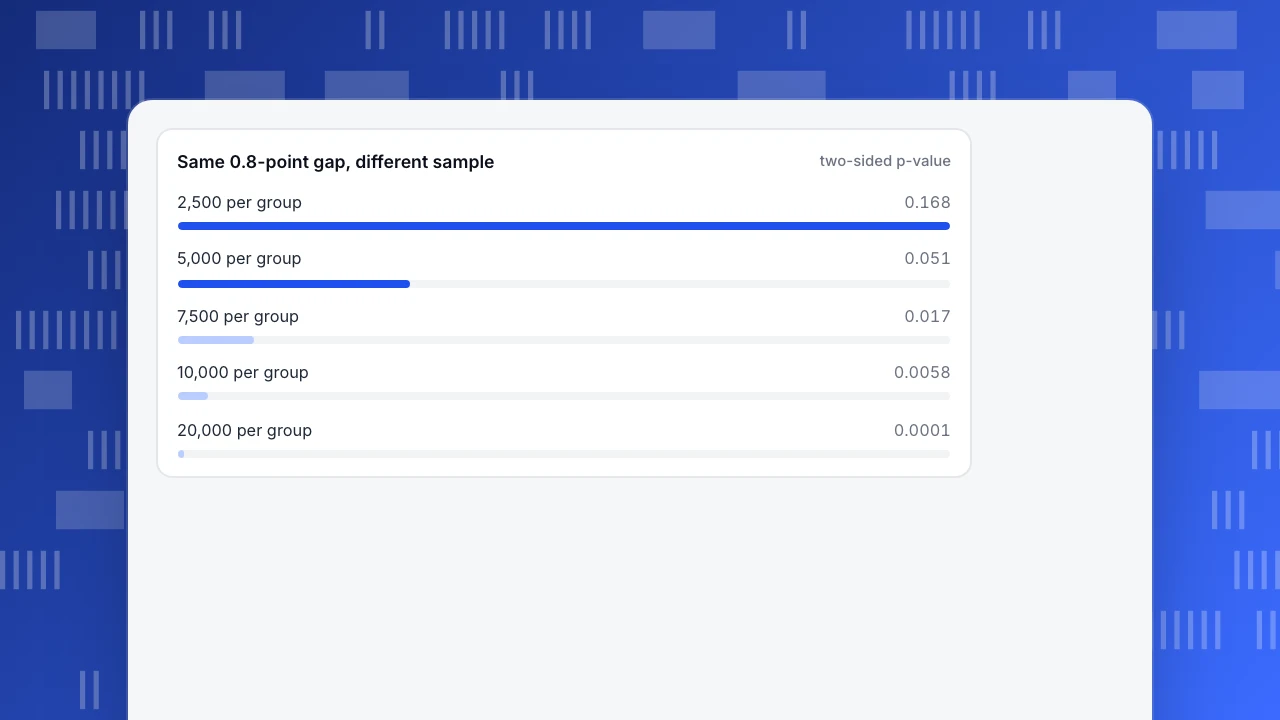
- The same 0.8-point gap goes from p = 0.168 to p = 0.0001 as visitors per group grow from 2,500 to 20,000, so p is not effect size
- Read p together with the confidence interval and a smallest worthwhile gap you set before the test
What does a p-value actually mean?
A p-value is a probability about your data, not about your hypothesis. It answers one question: if there were really no difference (the null hypothesis), how often would random variation alone produce a gap at least as large as the one you saw? A p-value of 0.03 means that with no real difference, about 3 experiments in 100 would show a gap this big or bigger. It does not mean there is a 97% chance the difference is real, and it does not mean there is a 3% chance you are wrong.
The American Statistical Association put this in writing in 2016: p-values can indicate how incompatible the data are with a specified statistical model; they do not measure the probability that the hypothesis is true or that the data were produced by chance alone; and they say nothing about the size or importance of an effect. Two words in the definition do most of the work. "At least as large" means the p-value counts the observed result and everything more extreme, not just the exact result. "Assuming no difference" means the whole calculation is done in a world where your idea is false, so the p-value cannot tell you how likely that world is. The short glossary definition is in p-value; this guide is about reading one in a real result.
How do you read a p-value, step by step?
Use the same five steps every time:
- Write down the null hypothesis in words. "The two versions convert at the same rate." If you cannot say what "no difference" is, you cannot read the p-value.
- Note the test and the threshold you committed to before looking. Two-sided or one-sided, and the cut-off, usually 0.05. Choosing the cut-off after seeing the p-value is a form of p-hacking.
- Find the p-value and the estimate it belongs to. Always read the two together: the observed gap, and the p-value for that gap.
- Say it as a sentence. "If the two versions really convert the same, a gap of 0.8 points or more in either direction would show up in about 17 experiments in 100." If the sentence sounds strange, the reading is probably wrong.
- Look at the range of plausible gaps before deciding. The confidence interval and the size of the gap tell you whether the result is worth acting on; the p-value only tells you how surprising it is under "no difference".
The next section applies the five steps to real numbers.
Worked example: 4.0% vs 4.8% with 2,500 visitors per group
Sample data: version A converts 100 of 2,500 visitors (4.0%), version B converts 120 of 2,500 (4.8%). The gap is 0.8 points, a 20% relative lift. Test: two-sided two-proportion z-test.
- Null hypothesis: the true conversion rate is the same for A and B.
- Pooled rate under the null: (100 + 120) ÷ 5,000 = 4.4%.
- Standard error of the gap under the null: √(0.044 × 0.956 × (1/2,500 + 1/2,500)) = 0.0058 (0.58 points).
- Test statistic: z = 0.008 ÷ 0.0058 = 1.38.
- p-value (two-sided): 2 × P(Z > 1.38) = 0.168. One-sided it would be 0.084.
The sentence: if A and B really convert the same, random variation alone would produce a gap of 0.8 points or more in either direction about 17% of the time. That is not unusual, so the result is not statistically significant at 0.05. For the gap to reach p = 0.05 with this sample, it would have to be about 1.1 points (for example 4.0% vs 5.1%).
Now the step that most write-ups skip. The 95% confidence interval for the gap is 0.8 ± 1.96 × 0.58 = −0.34 to +1.94 points, or from an 8% relative drop to a 48% relative lift. The data are compatible with B being slightly worse, no different or a lot better. "Not significant" here means "we cannot tell yet", and the test only had about 28% power to detect a true lift this size, so a miss is likely even if B really is better (see Type II error).
Sample size alone changes the p-value for the same observed rates:
| Visitors per group | Conversions A / B | z | Two-sided p |
|---|---|---|---|
| 2,500 | 100 / 120 | 1.38 | 0.168 |
| 5,000 | 200 / 240 | 1.95 | 0.051 |
| 7,500 | 300 / 360 | 2.39 | 0.017 |
| 10,000 | 400 / 480 | 2.76 | 0.0058 |
| 20,000 | 800 / 960 | 3.90 | 0.0001 |
The gap is 0.8 points in every row. Only the amount of data differs, which is why the p-value alone should never be treated as the size of an effect.
Same 0.8-point gap, different sample
two-sided p-valueWhat are the three most common misreadings?
| Misreading | Why it is wrong | Correct reading, using the example |
|---|---|---|
| "p = 0.168 means there is a 16.8% chance the two versions are the same" | The p-value is computed assuming they are the same; it cannot be the probability that assumption is true | "If they were the same, I would see a gap this large about 17% of the time" |
| "p < 0.05 means the effect is large or important" | A tiny gap with a huge sample is significant | With 500,000 visitors per group, 10.0% vs 10.2% gives p = 0.0009, but the gap is 0.2 points (interval 0.08 to 0.32) |
| "p > 0.05 means there is no difference" | A small sample cannot separate a real gap from noise | At p = 0.168 the interval still includes a 1.9-point lift; the test was underpowered, not conclusive |
A fourth, related error is believing that p < 0.05 means a 95% chance the result will replicate. It does not; the chance of a repeat depends on the true effect and the sample size, which the p-value alone does not reveal.
One more fact helps calibrate. With no real difference at all, about 5% of tests come out significant at 0.05. In a simulation of 3,000 experiments where both versions truly convert at 4.4%, 4.6% reached p < 0.05. So a single significant result against a background of many tests is exactly what chance produces. Running 20 independent tests gives a 1 − 0.95²⁰ = 64% chance of at least one false alarm. The remedy is to decide the number of comparisons in advance and correct the threshold for them, or to confirm any surprise with a second test.
| p-value | Plain reading | What it does not mean |
|---|---|---|
| 0.168 | With no real difference, a gap this big or bigger shows up in about 17 of 100 experiments | A 16.8% chance the two versions are the same |
| 0.05 | The usual cut-off: about 5 in 100 experiments under no difference | A 95% chance the effect is real or will repeat |
| 0.0009 | Very surprising under no difference | The effect is large; with 500,000 visitors per group a 0.2-point gap gives this |
| 0.30 with a wide interval | The data cannot separate a real gap from noise | There is no effect |
Sample data from the worked example; two-sided two-proportion z-test.
What should you look at besides the p-value?
The p-value answers one narrow question, so pair it with three other numbers:
| Question | Number to read | In the example |
|---|---|---|
| How surprising is this gap if there is no difference? | p-value | 0.168 |
| What range of true gaps does the data allow? | 95% confidence interval | −0.34 to +1.94 points |
| How big is the gap in terms that matter? | Effect size (absolute and relative) | +0.8 points, +20% relative |
| Was the test able to see a gap worth acting on? | Power or minimum detectable effect | About 28% power at 2,500 per group; about 10,300 per group for 80% |
The ASA statement says the same in its own words: a conclusion should not rest only on whether a p-value passes a threshold, and a p-value by itself is not a good measure of evidence. For reading the interval, see how to calculate a confidence interval; for the gap in practical terms, see effect size. The broader question of what "significant" should mean is in statistical significance.
How do you decide what to do with a result?
Match what you see to one row; do not use the p-value alone:
| What you see | What it means | What to do |
|---|---|---|
| p below the threshold, the interval's low end is above your smallest worthwhile gap | Evidence of a gap that matters | Act; confirm after rollout |
| p below the threshold, the interval sits mostly below the smallest worthwhile gap | A real but too-small gap | Usually do not act unless the change is free |
| p above the threshold, narrow interval around zero | A gap bigger than the interval's edge is unlikely | Treat as no meaningful difference |
| p above the threshold, wide interval spanning zero and a worthwhile gap | Inconclusive | Collect more data or test a bigger change |
| p just under 0.05 after many looks or comparisons | Possibly noise | Treat as a lead, and re-test |
"Smallest worthwhile gap" is a business number you set before the test: what lift would pay for the change?
What are the common mistakes?
- Peeking and stopping when p dips under 0.05. Checking every day and stopping at the first significant reading raises the false-alarm rate well above 5%. Fix the sample size or run length first.
- Reporting only the p-value. "p = 0.03" without the gap or the interval cannot be used to decide anything.
- Treating 0.049 and 0.051 as different worlds. They are nearly the same evidence. The 0.05 line is a convention, not a law of nature.
- Testing many segments and reporting the one that worked. One in twenty comparisons will be "significant" by chance.
- Applying a significance test to a non-random comparison. When people chose which version to use themselves, a small p-value tells you the gap is unlikely to be noise, not that the version caused it (see correlation vs causation).
How do you use TapCub to read a p-value?
TapCub does not run A/B experiments or compute p-values, so it has no significance test of its own. It supplies the inputs for the calculation above and keeps the data clean. Here is how the 4.0% vs 4.8% example is set up.
- Pull the conversions and visitors for each version. In Web analytics › Goals, read each version's goal conversions and visitors for the same dates. If you send the version name as an event property, you can compare the two groups' counts directly.
- Count real people only. TapCub counts bots and AI crawlers separately, so the 2,500 per group are people, not crawlers diluting the conversion rate.
- Run the test outside TapCub. Put the four numbers (conversions and visitors per version) into your own test or a calculator, and note the interval as well as the p-value. TapCub only measures; it does not do the test.
- Compare the same period in the trend. In All-platform analytics › Behavior › Event analysis, use the compare option to line a period up against the previous one, and mark the change in Configuration › Annotations so later readers know why it moved.
- Set a monitor for the metric you care about. In All-platform analytics › Operations › Monitors, a monitor on a built-in metric such as bounce_rate notifies you when it crosses a line. It only notifies; deciding whether the change is real stays with you.
FAQ
What does a p-value of 0.05 mean?
If there were no real difference, you would see a gap at least as large as yours in about 5 of 100 repeated experiments. It is a conventional cut-off for calling a result statistically significant, not a measure of how likely the finding is to be true.
What does a high p-value mean?
A high p-value means the gap you saw is the kind of gap random variation often produces when nothing is going on. It does not prove there is no effect. With a small sample, the interval around the gap can still include large real effects.
Is a p-value the probability that the null hypothesis is true?
No. The p-value is calculated assuming the null hypothesis is true, so it cannot give the probability that it is true. Getting that probability needs prior information and a different method, such as a Bayesian analysis.
Can a p-value be significant but unimportant?
Yes. With enough visitors, a 0.2-point difference in conversion can reach p < 0.001. Read the gap and its interval alongside the p-value, and compare the lower end of the interval with the smallest gap that would pay for the change.
Should I always use 0.05?
No. It is a convention. Choose the threshold before the test based on the cost of a false alarm and of a miss, and say so in the report. If you run many comparisons, tighten it or correct for the number of tests.
Sources
- Wasserstein, R. L., & Lazar, N. A. (2016). The ASA Statement on p-Values: Context, Process, and Purpose. The American Statistician, 70(2), 129–133.
- Greenland, S., et al. (2016). Statistical tests, P values, confidence intervals, and power: a guide to misinterpretations. European Journal of Epidemiology, 31, 337–350.
- NIST/SEMATECH e-Handbook of Statistical Methods, 7.3.3 How can we determine whether two processes produce the same proportion of defectives? (two-proportion test used in the example).
Was this article helpful?
We use your answers to fix and expand this page.
Couldn’t send. Please try again in a minute.
Thanks for the feedback. We’ll use it to improve this page.You’ve already sent feedback on this page. Thanks.

Customer Experience Consultant
Writes about live chat, visitor conversations, and self-service, sharing practical ways to make customer communication clearer and more effective.