Try it on your own data
Every report in this article is in the free plan. One snippet for web and apps, up to 10 sites.
Start freeUser analytics is the analysis of what individual people do in your product, to answer who uses it, how they use it and how well it works for them. The unit is the person, not the page, so it needs a way to recognise the same person again. Below: the questions it answers, what to set up first and a worked example from outcome to decision.
What you will learn
- Group questions as who, how and how well, and always compare groups instead of reading one total
- Identify logged-in people first; in the sample only 18% of visitors could be profiled
- Walk from one outcome to one predictive step to one splitting property, as in the 280 to 310 example
What is user analytics, and how is it different from web analytics?
User analytics is the practice of collecting and analysing what individual people do in your product, so you can answer three questions: who is using it, how they use it, and how well it works for them. The unit is the person, not the page. Web analytics asks "how many visits did the pricing page get?"; user analytics asks "of the people who signed up last month, how many reached the point where the product is useful, and who came back?"
| Web analytics | User analytics | |
|---|---|---|
| Main unit | Pageviews, sessions, visitors | People (or accounts) and their actions over time |
| Typical question | Which pages and sources bring traffic? | Which kinds of users get value and stay? |
| Needs | A tracking script | A tracking script plus a way to recognise the same person again |
| Main reports | Sources, pages, bounce | Segments, funnels, retention, paths, user profiles |
They overlap, and the second one builds on the first. The difference matters because a traffic number can rise while the number of people getting value falls. For the tracking side of the same idea, see user behavior tracking; for how behaviour is read once it is collected, behavioral analytics; and for the product-specific version, product usage analytics.
What questions does user analytics answer?
Group the questions the same way the definition does. Each row below names a decision and the measure that informs it.
| Group | Question | Measure |
|---|---|---|
| Who | Who are the new users this month, and where did they come from? | New users by source, plan or country |
| Who | Which users are the most engaged? | Active days per week, events per person |
| Who | How do different kinds of users differ? | Segments built from properties and behaviour |
| How | What do users do first, and what do they do next? | Paths and event sequences |
| How | Where do people stop in a flow such as signup? | Funnel conversion at each step |
| How | Which features do people use, and how often? | Users per feature, frequency |
| How well | Do new users come back? | Retention by cohort |
| How well | How long does it take to reach the first useful action? | Time between two events |
| How well | Who is drifting away? | Users inactive for 7, 14 or 30 days |
Two habits keep the list useful. First, start from a decision (change onboarding, retire a feature, fix a checkout step) and pick the question that decision depends on. Second, always compare groups. A single number such as "40% return in week 2" says little; "40% for desktop sign-ups and 20% for mobile" says where to look.
What do you need in place before you can answer them?
Three things, in this order.
1. A way to recognise the same person. Anonymous tracking can tell you a device came back. It cannot tell you that the person on the phone and the person on the laptop are one customer. Once someone logs in, you can attach your own user ID. Google describes its User-ID feature as letting you associate your own identifiers with individual users so behaviour can be followed across sessions, devices and platforms, with each ID counted as a separate user. Until a person is identified, they show up in visitor counts but cannot have a profile.
Be precise about which "users" a report counts. Google's own definitions show the spread: total users are everyone who triggered any event in the range, active users are those with an engaged session or certain engagement signals, new users are those whose first visit or first open fell in the range, and returning users are those with at least one earlier session. Four numbers with the same word in them. Pick one definition per report and write it down. The related glossary entry is user ID.
2. A short, named list of events. Five or six events are enough to start: signed up, finished setup, used the core feature, invited someone, paid. If everything is tracked but nothing is named, every question needs a developer.
3. A handful of user properties. Plan, country, signup source and signup date explain most differences between groups. Add properties when a question needs them, not before.
Sample data: a site gets 10,000 visitors in a month and 1,800 of them log in. The identified share is 1,800 ÷ 10,000 = 18%. The other 82% can be counted, but not profiled or followed across devices, so any conclusion about "users" is a conclusion about those 18%. Say so in the report.
How do you get from a question to a decision? A worked example
Sample data: 1,000 people signed up last month. The question is why so few come back. The steps:
- Measure the outcome. 280 of the 1,000 (28.0%) returned in week 2.
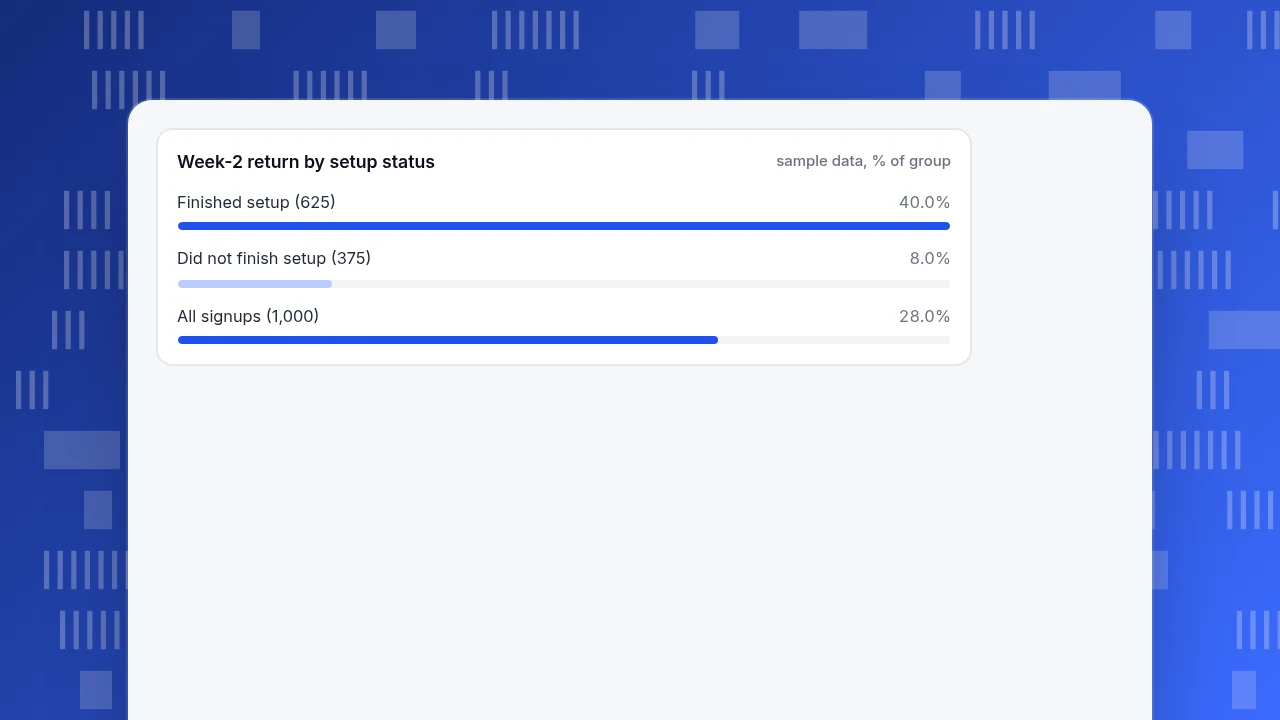
- Find the step that predicts it. 625 people finished setup (62.5%): 490 of the 700 desktop signups (70.0%) and 135 of the 300 mobile signups (45.0%). Of the 625 who finished setup, 250 returned in week 2 (40.0%). Of the 375 who did not, 30 did (8.0%). 250 + 30 = 280, which matches step 1.
- Split by a property. The setup gap between desktop and mobile is 70.0% − 45.0% = 25 points.
- Estimate the prize. If mobile reached the desktop rate, 300 × 25% = 75 more people would finish setup. At the 40.0% return rate for finishers, that is 75 × 0.40 = 30 more returning users, taking week-2 return from 280 to 310 (31.0%).
| Group | People | Returned in week 2 |
|---|---|---|
| Finished setup | 625 (62.5% of signups) | 250 (40.0%) |
| Did not finish setup | 375 (37.5%) | 30 (8.0%) |
| All signups | 1,000 | 280 (28.0%) |
The decision: fix mobile setup before anything else. The 30 is a ceiling, not a forecast, because the people mobile would newly convert may be less committed than average and return less often. Read it as "worth a try", and check the real number after the change. Notice what made this work: one outcome, one step that predicts it, one property that splits the groups.
Week-2 return by setup status
sample data, % of groupWhich user analytics reports should you start with?
| Report | Use it to | Watch out for |
|---|---|---|
| Segments | Define a group once (for example, mobile signups last month) and reuse it | Segments of anonymous visitors usually cannot exist; they need identified people |
| Funnel | See where people stop between two events | A funnel shows where, not why; pair it with a recording or a conversation |
| Retention | See whether a group is still active in week 1, 2, 4 | A period that has not finished is incomplete, not zero |
| Paths | See what people do before and after an event | Paths are noisy; start from a specific event, not the whole product |
| User profile | Read one person's timeline to understand a puzzling case | Good for understanding, not for measuring; one case is an example, not a rate |
Start with retention and a funnel on the same cohort, as in the example. Add paths and profiles when those two raise a "why" question. Terms used here are explained in segment, funnel, cohort and retention.
| Report | Use it to | Watch out for |
|---|---|---|
| Segments | Define a group once and reuse it | Anonymous visitors usually cannot be segmented |
| Funnel | See where people stop between two events | Shows where, not why |
| Retention | See whether a group is still active in week 1, 2, 4 | An unfinished period is incomplete, not zero |
| Paths | See what people do before and after an event | Noisy; start from a specific event |
| User profile | Read one person's timeline | One case is an example, not a rate |
Start with retention and a funnel on the same cohort.
What should you watch out for with personal data?
User-level analytics is by nature closer to personal data than aggregate traffic counts, so a few habits are worth building in from the start. This is general information, not legal advice; ask your own advisor what applies in your markets.
- Collect what the question needs. The EU's GDPR sets the principle of data minimisation in Article 5(1)(c): personal data must be adequate, relevant and limited to what is necessary for the purpose. A plan name and a signup date serve most questions; a full date of birth rarely does.
- Use an internal ID, not an email address, as the identifier. An email in an event property is copied into every export and screenshot.
- Do not send what you do not need. Form contents, passwords and free-text messages should never go into events.
- Respect consent and local rules. Whether you need consent depends on how you collect and where your users are.
- Limit who can see profiles, and for how long. Per-person timelines are for the few people who need them, and old detail should expire on a schedule.
What mistakes make user analytics misleading?
- Reading anonymous visitors as users. In the example above, 82% of visitors were never identified.
- Using one overall number. The 62.5% setup rate hid a 45.0% group and a 70.0% group.
- Mixing definitions. "Active users" in one report and "total users" in another will never reconcile.
- Treating correlation as cause. People who finish setup return more often (40.0% vs 8.0%), but part of that is that committed people do both. The mobile fix in step 4 is an estimate to be tested, not a promise.
- Reading an unfinished period as zero. The newest cohort has not had time to return.
- Looking at one case. A single profile is a story; a segment is a rate. Use profiles to form questions and segments to answer them.
How to do user analytics in TapCub
Take the example above, and imagine running it in TapCub.
- Identify logged-in people. Call
tapcub.login()when someone logs in and identified mode is on for the project (see identifying users). They then appear in All-platform analytics › Users › People, where a profile shows linked devices, segments and a day-by-day timeline. Anonymous visitors are still counted in the web reports, but they do not get a profile or join segments. - Build the segment once. In All-platform analytics › Users › Segments & tags, create a rule segment such as "signed up last month, on mobile" (rule segments refresh daily or on demand). The same segment can then be used in the funnel and retention views.
- Run the funnel. In All-platform analytics › Behavior › Behavior analysis, build a funnel from signed up to finished setup to returned, and read where mobile and desktop drop. Use the segment to compare.
- Read retention. In the same place, pick retention: start event "signed up", return event any activity, by day or week. Each row is a cohort, with a count and a rate per period, and a period that has not ended is shown empty, not zero. The lifecycle view adds counts of new, returning, resurrecting and dormant people each week or month.
- Open a profile to see why. For a mobile user who stopped at setup, open their profile in People and read the timeline for errors or frustration signals before the drop. That gives you the next question to test.
TapCub does not survey users or message them, and it does not run experiments; it shows who did what, and how that changed over time. Which questions to ask, and what to change, stays with you.
FAQ
What is user analytics?
User analytics is the collection and analysis of what individual people do in a product or on a site, to learn who uses it, how they use it and how well it works for them. It focuses on people and their actions over time, using tools such as segments, funnels, retention and user profiles.
What is the difference between user analytics and web analytics?
Web analytics counts traffic: visits, pages and sources. User analytics follows people through the product: what they do, whether they finish key steps and whether they return. You can see 10,000 visits in web analytics; user analytics tells you how many of those people got value, which needs a way to recognise the same person again.
What questions can user analytics answer?
It answers who the users are, such as new users by source or plan; how they use the product, such as the steps they take and where they stop; and how well it works, such as whether they come back and how long it takes to reach the first useful action. Each is best answered by comparing groups, not looking at one overall number.
What do I need to start with user analytics?
A way to recognise the same person (a login ID), a short named list of events such as signed up, finished setup and paid, and a few properties such as plan and country. You can start with five events. Add more only when a question needs them.
Is user analytics the same as tracking individual users?
Not necessarily. Many questions need only groups: cohorts, segments and rates. Per-person timelines are useful for understanding a case but carry more privacy responsibility. Collect only what the question needs, use an internal ID rather than an email, and keep access to profiles narrow.
Sources
- Google. User-ID, Analytics Help. Associating your own identifiers with individual users. Checked 2026-11-19.
- Google. Understand user metrics, Analytics Help. Definitions of total, active, new and returning users. Checked 2026-11-19.
- Mixpanel. Retention, product documentation. A retention measurement pairs a first event with a later return event and counts unique users. Checked 2026-11-19.
- European Union. General Data Protection Regulation (EU) 2016/679, Article 5(1)(c), data minimisation. Checked 2026-11-19.
Was this article helpful?
We use your answers to fix and expand this page.
Couldn’t send. Please try again in a minute.
Thanks for the feedback. We’ll use it to improve this page.You’ve already sent feedback on this page. Thanks.

Data Analyst
Explores traffic sources, conversion funnels, and retention, using clear metric definitions and concrete examples to explain what the numbers mean.