Try it on your own data
Every report in this article is in the free plan. One snippet for web and apps, up to 10 sites.
Start freeA user journey map shows the stages a person goes through to reach a goal, with the actions, pain points and metrics at each stage. It is only useful when filled with real path data: reach per stage, the move to the next stage and friction signals. Below are three worked examples you can recompute, then a six-step build.
What you will learn
- Define every stage by a page or an event you can detect, so anyone can recount it
- Use reach and next-stage move to rank stages by lost sessions you can influence
- Treat a friction score as a pointer to where to look, not as emotion
What is a user journey map, and how is it different from a user flow?
A user journey map lays out the stages a person goes through to reach a goal in your product or site, with what they do, where they get stuck and what you should change at each stage. It is a map of an experience over time, not a screen diagram.
Three similar artefacts get mixed up, so it helps to separate them:
| Artefact | What it shows | Best source of truth |
|---|---|---|
| User flow | The screens and decisions in one task | Product design and the click path |
| User journey map | Stages, actions, pain points and metrics over the whole goal | Path data plus a few interviews |
| Customer journey map | The same, across every channel and teams, often including offline | Cross-team research and data |
If you need the screen-level view, see user flow. If you are mapping the full relationship across marketing, sales and support, start with customer journey map and customer journey stages. This article covers the product and site version, and the one claim that makes it useful: fill the map with real path data, not with what the team imagines.
What are the parts of a user journey map you can fill with data?
Most templates have the same five rows. The difference between a poster and a tool is whether each row is filled from observation:
| Part | The imagined version | The data version |
|---|---|---|
| Persona and goal | A named character with a stock photo | The goal, as one measurable end event ("started a trial") |
| Stages | Awareness, consideration, decision | Named stages, each defined by pages or events |
| Touchpoints | "Website, email, support" | The pages and events that put a session in the stage |
| Metrics | A feeling about "high" or "low" | Reach, move to the next stage, exit share |
| Pain points | Guesses from a workshop | Errors, repeated frustrated clicks and exits at that stage |
Two rules keep the data version honest. Define each stage by something you can detect (a page path or a named event), so that anyone can recount it. And keep the stage count small: five to nine stages is plenty for one goal, because every extra stage adds a row nobody reads.
| Part | The imagined version | The data version |
|---|---|---|
| Persona and goal | A named character | One measurable end event |
| Stages | Awareness, consideration, decision | Named stages defined by pages or events |
| Metrics | A feeling of high or low | Reach, next-stage move, exit share |
| Pain points | Workshop guesses | Errors, frustrated clicks and exits per stage |
Fill each row from observation before the workshop.
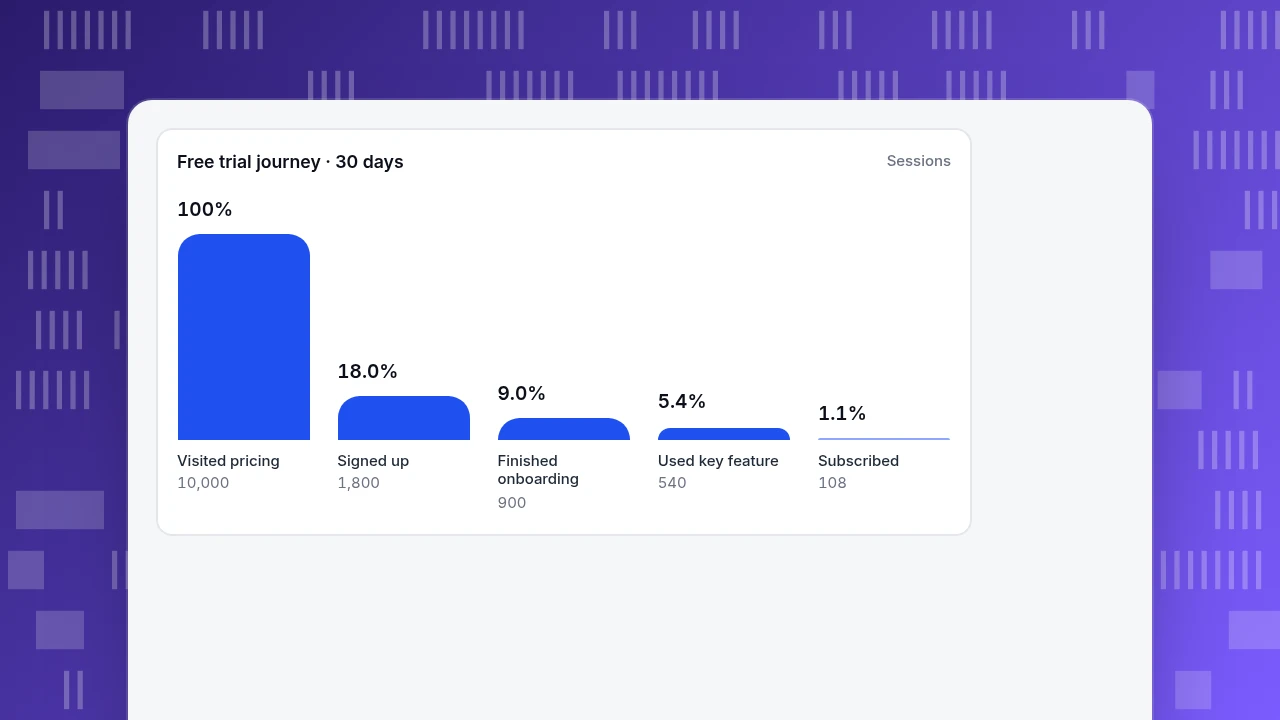
Example 1: how does a SaaS free-trial journey look with real reach numbers?
Sample data: a software product, 30 days, five stages. Reach is counted in sessions, and a session counts as moving to the next stage only if it hit the stage before it earlier in the same visit.
| Stage | Sessions reaching it | Reach vs first stage | Moved to next stage |
|---|---|---|---|
| Visited pricing | 10,000 | 100% | 18.0% |
| Signed up | 1,800 | 18.0% | 50.0% |
| Finished onboarding | 900 | 9.0% | 60.0% |
| Used the key feature | 540 | 5.4% | 20.0% |
| Started a subscription | 108 | 1.1% | n/a |
Recomputing: 1,800 ÷ 10,000 = 18.0%; 900 ÷ 1,800 = 50.0%; 540 ÷ 900 = 60.0%; 108 ÷ 540 = 20.0%; 108 ÷ 10,000 = 1.08%.
What the map tells you: half of the sign-ups never finish onboarding, and four in five people who reached the key feature never subscribe. The last gap is the larger one in absolute terms (432 sessions) and sits after the product has already shown its value, so the next question is about the offer, not the interface: what happens at the end of the trial, and what does the upgrade prompt say?
Use the map as a ranking device, not a verdict. The weakest stage is the one with the largest number of lost sessions that you can influence. Pricing-page visitors who do not sign up (8,200 sessions) are the biggest absolute loss, but most are researching, so the fix is clearer pricing, not a bigger button.
Free trial journey · 30 days
SessionsVisited pricing
10,000
Signed up
1,800
Finished onboarding
900
Used key feature
540
Subscribed
108
Example 2: what does an e-commerce purchase journey reveal once you add friction signals?
Reach tells you where people leave; friction signals tell you where the experience hurts. A simple stage score subtracts weighted penalties from 100: 1.5 × the error rate, 1.5 × the share of sessions with repeated frustrated clicks, and 0.5 × the exit rate (the share of sessions whose last page was in that stage). The weights are a convention, not a physical law; what matters is that the same formula is applied to every stage.
Sample data: an online store, one month.
| Stage | Sessions | Moved to next stage | Error rate | Frustration rate | Exit rate | Score |
|---|---|---|---|---|---|---|
| Landing | 20,000 | 55.0% | 0.5% | 1% | 45% | 75.3 |
| Product view | 11,000 | 30.0% | 1% | 2% | 25% | 83.0 |
| Cart | 3,300 | 50.0% | 2% | 4% | 30% | 76.0 |
| Checkout | 1,650 | 50.0% | 6% | 8% | 40% | 59.0 |
| Order | 825 | n/a | n/a | n/a | n/a | n/a |
For checkout: 100 − 1.5 × 6 − 1.5 × 8 − 0.5 × 40 = 100 − 9 − 12 − 20 = 59. For landing: 100 − 0.75 − 1.5 − 22.5 = 75.25, rounded to 75.3.
Two readings. Checkout has the same move rate to the next stage as the cart (50%) but a score 17 points lower, driven by errors and frustrated clicks. That points to a technical or form problem, not to price hesitation. Landing has a high exit rate (45%) but a healthy score, because landing exits are normal and carry no errors or frustration. The score separates "people left" from "people were hurt".
A word of caution: a score is a proxy built from behaviour, not a measurement of feelings. Use it to decide which stage to watch next in a replay or heatmap, then confirm with a few real conversations.
Example 3: how do you map a lead-generation journey with only a few stages?
Not every journey is long. A content site that wants enquiries can be mapped in four stages.
Sample data: a B2B site, 30 days.
| Stage | Sessions reaching it | Reach vs first stage | Moved to next stage |
|---|---|---|---|
| Blog article | 8,000 | 100% | 15.0% |
| Product or pricing page | 1,200 | 15.0% | 30.0% |
| Form viewed | 360 | 4.5% | 20.0% |
| Form submitted | 72 | 0.9% | n/a |
1,200 ÷ 8,000 = 15.0%; 360 ÷ 1,200 = 30.0%; 72 ÷ 360 = 20.0%; 72 ÷ 8,000 = 0.9%.
The map answers a practical question: is the blog an entry point or a dead end? Only 15% of article sessions ever reach a product or pricing page. Fixing the internal links in the three highest-traffic articles is likely to move more enquiries than rewriting the form, whose 20% completion rate is already respectable for a contact form.
Watch for two quirks. A later stage can be larger than the one before it when you compare raw counts, because reach is measured against the first stage and visitors can skip a middle stage (a returning reader may go straight to the form). And a stage defined only by an event, with no page, cannot be tied to a page for errors or exits, so its friction score looks better than it is.
How do you build a user journey map from your own data in six steps?
- Pick one goal and one audience. "Visitors who become trial users" is a goal; "everyone" is not.
- Write the end event first. Name the event or page that proves success, such as
trial_started. - List the stages backwards. From the end event, ask what a person must have done just before, and list five to nine stages.
- Define each stage with pages or events. Use one or two page paths or event names per stage; a page prefix works for sections such as
/blog/. - Read reach and next-stage move for two periods. Compare the same weekdays and look for the stage with the most lost sessions you can influence.
- Add friction and a short qualitative check. Open the worst stage's top pages, watch a few recordings if you have them enabled, and talk to three or five users. Write one change per stage and an owner.
Redraw the map after you ship a change. A map that never changes is a poster.
Common mistakes with user journey maps
- Starting from a workshop, not from data. The first map will be fiction. Fill it from path numbers, then use the workshop to explain them.
- Too many stages. Twenty stages produce twenty small percentages and no priority.
- Mixing audiences. New and returning visitors take different paths; mapping them together blurs both.
- Treating the friction score as emotion. In the e-commerce sample, 59 means "errors and frustrated clicks are high at checkout", not "customers are unhappy".
- Calling a drop-off a failure. In the SaaS sample, 82% of pricing-page visitors never sign up, and most of them were only comparing options.
- Mapping once. Journeys change with every release and campaign.
How to build a user journey map in TapCub
Here is how the SaaS team in the first example would build its map in TapCub. TapCub measures the path and the friction; the interviews and the fixes are yours.
- Create the journey. Open All-platform analytics › Business › Journey maps and click New journey. Add up to 20 stages in real order. Each stage needs at least one page or one event, and at most 20 of each; a page is a full path, or a prefix when it ends with
*. - Define the stages. Put one page pattern or event name per line, save, pick your dates and read reach and drop-off. Reach is counted in sessions; moving to the next stage requires the same session to hit this stage first and the next stage later. The first stage is 100%, and the later rates are relative to it.
- Read friction. For stages that have page patterns, the map shows error, frustration (rage clicks) and exit shares and a 0 to 100 sentiment: 100 minus 1.5 times the error rate, 1.5 times the frustration rate and 0.5 times the exit rate, the formula used in the checkout example. When sentiment falls, see which of the three moved, then open the top pages for that stage.
- Go one level deeper. For the stage that scores lowest, open All-platform analytics › Behavior › Heatmaps or All-platform analytics › Behavior › Session replay (session replay is off by default and has to be turned on).
- Start from a preset if it fits. An industry pack installs one journey named after the pack, for example for B2B or SaaS products, which you can edit.
Limits to know: an event-only stage scores error, frustration and exit as zero, so its sentiment sits high without meaning the experience was good; events need a session ID, and server events with no session never enter a stage; creating and editing journeys needs an owner or admin. TapCub does not run interviews or measure emotions: the sentiment is a proxy built from errors, rage clicks and exits.
FAQ
What is a user journey map?
A user journey map shows the stages a person goes through to reach a goal in a product or site, with the actions, pain points and metrics at each stage. The version that is worth maintaining is built from path data (reach and next-stage move per stage), not from assumptions.
What is the difference between a user journey map and a customer journey map?
A user journey map usually covers one goal inside a product or site, such as sign-up to first value. A customer journey map covers the whole relationship across channels and teams, including marketing, sales and support, and sometimes offline steps. The method is the same; the scope differs.
How many stages should a user journey map have?
Five to nine for one goal is usually enough. Each stage should be defined by a page or event you can detect, so anyone can recount it. More stages mean more small percentages and a harder time deciding which stage to fix first.
How do you create a user journey map from data?
Pick one goal, name its end event, list the stages backwards from it, define each stage with pages or events, then read reach and next-stage move for two periods. Add friction signals and a few interviews for the worst stage. Write one change and one owner per stage.
Is the sentiment score on a journey map real emotion?
No. It is a behavioural proxy computed from error rate, repeated frustrated clicks and exit share. It tells you where to look, not how customers feel. Confirm with recordings or a few conversations before you decide what to change.
Sources
- Sarah Gibbons. Journey Mapping 101. Nielsen Norman Group — the components of a journey map and why it should be based on research. Verified 2026-11-19.
- Sarah Gibbons. UX Mapping Methods Compared: A Cheat Sheet. Nielsen Norman Group — how journey maps, experience maps and service blueprints differ. Verified 2026-11-19.
Was this article helpful?
We use your answers to fix and expand this page.
Couldn’t send. Please try again in a minute.
Thanks for the feedback. We’ll use it to improve this page.You’ve already sent feedback on this page. Thanks.

Product Adoption Consultant
Explores customer onboarding, live conversations, and self-service, turning common usage questions into practical guidance and improvements.