Try it on your own data
Every report in this article is in the free plan. One snippet for web and apps, up to 10 sites.
Start freeYear is quantitative when you use it for differences, averages or trends over time, and categorical when it only names a group such as model year 2019. The test: a number is quantitative only if arithmetic on it means something. 2021 − 2012 = 9 years is a real interval; the average of zip codes 02134, 94105, 10001 and 60601 is 41,710.25, which is no place. Below: the three-question test, a table for year, zip code, rating and ID, and a worked example.
What you will learn
- Year is quantitative for differences and trends (interval scale) and categorical when it is a group label
- Zip codes and IDs are labels: store them as text, never average them and never drop the leading zero
- Name derived columns by use, such as signup_year and years_since_signup, so the type is clear
Is year categorical or quantitative?
Year can be either, and which one it is depends on what you do with it, not on the fact that it is written with digits. Treat it as quantitative when you want distances, averages or trends over time: "these customers joined 9 years apart", "sales rise about $10k per year". Treat it as categorical when it is a label for a group: "model year 2019", "class of 2024", "fiscal year". A column of years can be both in the same analysis; what matters is which question each step asks.
The textbook definitions make this precise. Minitab's help defines the values of a categorical variable as mutually exclusive categories or groups, and the values of a quantitative variable as numbers that usually represent a count or a measurement. Its examples include survey codes such as 1 for Agree and 2 for Neutral, where numbers are only labels for groups. The glossary entries on categorical variables and data types cover the vocabulary; this page gives you a way to decide in under a minute, and a table for year, zip code, rating and ID. The claim to keep: a number is quantitative only if arithmetic on it means something; otherwise it is a label that happens to be written in digits.
What is the three-question test?
Ask these in order. Stop at the first "no".
- Does a difference mean something? 2021 − 2012 = 9 years is a real interval. 94105 − 02134 is not a distance of anything.
- Does an average mean something? The average of the years 1998, 2005, 2012, 2019 and 2021 is 2011, a midpoint in time. The average of zip codes 02134, 94105, 10001 and 60601 is 41,710.25, which is not a place.
- Would swapping the labels change the answer? If you could replace the numbers with letters or colours and the analysis would be identical, they were labels all along. Stevens, who named the four levels of measurement, gave the example of numbering football players: the numerals are used only as labels, and words or letters would serve as well.
If you pass all three, it is quantitative. If you pass the first only, it is usually ordinal or interval, depending on whether the gaps are even. If you pass none, it is categorical.
| Value | Type | Treat it as |
|---|---|---|
| Year as a date | Quantitative (interval) | Numbers: differences and trends, no ratios |
| Year as a group label | Categorical | Groups: one bar per year |
| Zip code, ID, phone | Categorical (nominal) | Text: group and count, never average |
| Rating 1 to 5 | Ordinal | Distribution and median; mean with care |
The same column can be used both ways; decide per question.
Why is year an interval, not a ratio, quantity?
Stevens's 1946 paper "On the Theory of Scales of Measurement" (Science 103: 677–680) separates scales by which transformations leave their meaning intact. Calendar dates are his example of a scale with an arbitrary zero: dates on one calendar are transformed to those on another with the same linear equation, x' = ax + b, and it is meaningless to say one value is twice or some other proportion greater than another. Year 2000 is not "twice" year 1000. Periods of time, such as 9 years, can be measured on a ratio scale.
That gives a practical rule for years:
- Differences are fine. Age at signup, tenure, "years since launch".
- Ratios of years are not. Do not divide 2024 by 2012.
- Averages are fine as a midpoint, and the mean and standard deviation are statistics Stevens associated with interval scales.
- If you want ratios, convert to a period: years since a start date, or age.
How do year, zip code, rating and ID compare?
| Value | Example | Type | Why | What to do |
|---|---|---|---|---|
| Year as a date | 2012, 2021 | Quantitative (interval) | Differences and trends make sense; the zero is arbitrary | Keep numeric; use differences and slopes; do not take ratios |
| Year as a group label | Model year 2019, class of 2024 | Categorical | The year names a group; no arithmetic is intended | Count, compare groups, use one bar per year |
| Age or years since a start | 37, 9 | Quantitative (ratio) | Zero means none; ratios make sense | Average, ratio, regression |
| Zip code | 02134, 94105 | Categorical (nominal) | A label for a delivery area; arithmetic is meaningless | Store as text; group; never average |
| Rating 1 to 5 | 4 | Ordinal | Order is real; gaps may not be equal | Show the distribution and median; mean with care |
| ID | 1001, 1002 | Categorical (nominal) | Identifies, does not measure | Store as text; count distinct |
| Phone number | 5551234 | Categorical (nominal) | An identifier | Store as text |
Zip codes deserve the extra note because they look geographic. The US Census Bureau says ZIP Codes are stored as discrete addresses tied to delivery points, a point-based dataset unsuitable for mapping and many analysis applications; its ZIP Code Tabulation Areas (ZCTAs) are generalized areal representations built from census blocks, and not every valid ZIP Code has a ZCTA. If you need an area, use the ZCTA and its definition, not the raw code.
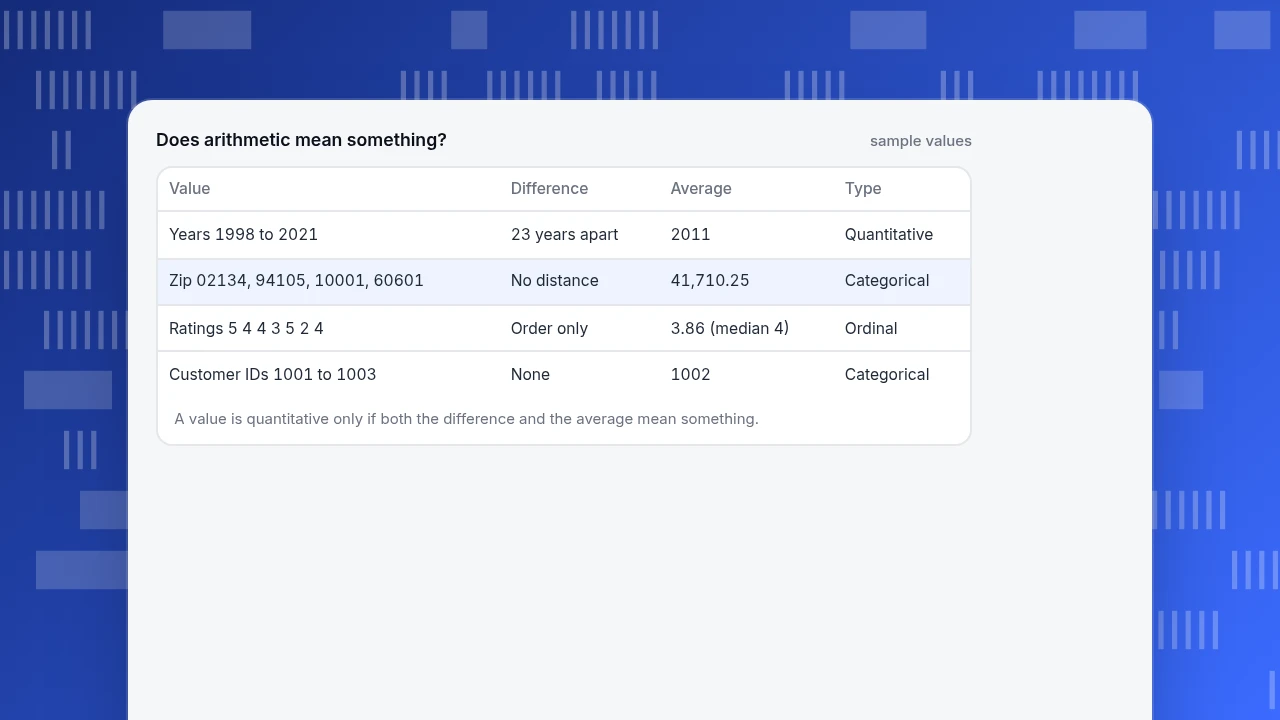
Does arithmetic mean something?
sample values| Value | Difference | Average | Type |
|---|---|---|---|
| Years 1998 to 2021 | 23 years apart | 2011 | Quantitative |
| Zip 02134, 94105, 10001, 60601 | No distance | 41,710.25 | Categorical |
| Ratings 5 4 4 3 5 2 4 | Order only | 3.86 (median 4) | Ordinal |
| Customer IDs 1001 to 1003 | None | 1002 | Categorical |
A value is quantitative only if both the difference and the average mean something.
What does the choice change in a real analysis?
Sample data: yearly revenue in $ thousands for 2019 to 2023 is 100, 112, 95, 130, 141.
- Year as quantitative. A least-squares line through the five points has a slope of exactly +10 per year (the mean year is 2021 and the mean revenue is 115.6; the fitted line runs from 95.6 in 2019 to 135.6 in 2023). One number summarises the trend, and it extrapolates: a 2024 estimate of 145.6.
- Year as categorical. Each year is its own group. Against 2019 the differences are 0, +12, −5, +30 and +41. That shows the 2021 dip the line smooths over, but it says nothing about 2024, and with one observation per year it cannot say whether the gaps are noise.
Neither is wrong. The numeric treatment answers "what is the trend?" and the categorical one answers "how did each year differ?". If you pick the wrong one for the question you get a silent error: a categorical year in a regression produces a coefficient per year and no trend; a numeric year in a "compare groups" chart produces a continuous axis with gaps for years that are missing.
What mistakes does this cause?
- Losing leading zeros. Reading the zip code 02134 as a number gives 2134, because int("02134") is 2134, and the text you wanted is gone. Read identifier columns as text when you load the file.
- Averaging identifiers. The mean of customer IDs 1001, 1002 and 1003 is 1002, a number that identifies nobody.
- Treating 1 to 5 ratings as a ratio scale. A 4 is not twice a 2. The mean 3.86 of the ratings 5, 4, 4, 3, 5, 2, 4 and their median 4 both appear in practice; report the distribution next to either.
- Taking ratios of years. "2024 is 0.6% bigger than 2012" is arithmetic with no meaning.
- Letting software guess. A spreadsheet or library that sees digits will often assume a number. Check the type before you chart or model.
- Switching halfway. If you describe a year as a label in one chart and as a quantity in the next, say so, or readers will think the data changed.
When is year both?
Cohort analysis uses both at once. A "signup year" column is a categorical grouping variable (one line per cohort), while the difference between the signup year and the current year is a quantitative age for that cohort. Seasonality is a related case: the calendar year is numeric for the trend but the month is a repeating label, because December and January are neighbours.
A simple way to keep the two apart is to give them different names in your data: signup_year for the group label and years_since_signup for the quantity. Then the column name carries the type.
How to do it with TapCub
TapCub asks for a type on every event property, which is where this decision shows up. The docs list five types: String, Number, Boolean, Datetime and List. For the examples above:
- In All-platform analytics › Data › Tracking plan, define the property when you plan the event: its name, its type, whether it is required and an example value. A
signup_yearused for cohort grouping is a String label; ayears_since_signupis a Number. - Send zip codes, IDs and phone numbers as String. The property distribution reads only values that parse as numbers and splits them into equal-width buckets from the minimum to the 99th percentile, so a zip code sent as a Number would be drawn as a histogram of codes that mean nothing.
- In All-platform analytics › Data › Property dictionary, check the Type column of the properties that already exist, on the Event, User and Account tabs. The docs warn that a wrong type breaks sums and filters, and that once you save an edit, later scans do not overwrite the type. Fix mismatches there, not in each chart.
- In the same dictionary, add a validation rule with the expected type for properties that must stay text, such as
zip_code. A violation can warn, drop the property or block the event, so a number that sneaks in is caught at intake. - In All-platform analytics › Behavior › Behavior analysis, use the distribution view on a Number property (such as years since signup) to see its shape, mean and median. For groups, use Event analysis and break down by a dimension such as plan or country.
TapCub cannot know whether a number is a measurement or a label; you declare it, so decide the type before you instrument.
FAQ
Is year categorical or quantitative?
Either, depending on use. As a date or an age you take differences and trends with, it is quantitative (interval). As a group label such as model year 2019, it is categorical. Ask whether subtracting and averaging the values means something.
Is zip code categorical or quantitative?
Categorical. A zip code labels a delivery area; adding or averaging codes means nothing, and storing it as a number drops leading zeros (02134 becomes 2134). The Census Bureau notes ZIP Codes are tied to delivery points, not areas.
Is a rating from 1 to 5 categorical or quantitative?
It is ordinal: the order is real, but the gaps may not be equal and a 4 is not twice a 2. Show the distribution and the median, and use the mean with care.
Is an ID number categorical or quantitative?
Categorical. An ID identifies a record and measures nothing; arithmetic on it has no meaning, as the football-player numbering example in Stevens's paper shows. Store IDs as text and count distinct values.
Can the same variable be categorical in one analysis and quantitative in another?
Yes. Year is the standard case: one bar per year treats it as a label, and a trend line treats it as a quantity. Choose by the question each chart answers, and name derived columns so the type is clear.
Sources
- S. S. Stevens. On the Theory of Scales of Measurement. Science 103 (2684): 677–680, 1946 — the four scales, calendar dates and the linear transformation, and football-number labels. Checked 2026-11-20.
- Minitab Support. Comparison of categorical and quantitative variables — definitions and numeric-code examples. Checked 2026-11-20.
- U.S. Census Bureau. ZIP Code Tabulation Areas (ZCTAs) — ZIP Codes versus ZCTAs. Checked 2026-11-20.
Was this article helpful?
We use your answers to fix and expand this page.
Couldn’t send. Please try again in a minute.
Thanks for the feedback. We’ll use it to improve this page.You’ve already sent feedback on this page. Thanks.

Customer Experience Consultant
Writes about live chat, visitor conversations, and self-service, sharing practical ways to make customer communication clearer and more effective.