Try it on your own data
Every report in this article is in the free plan. One snippet for web and apps, up to 10 sites.
Start freeTo increase product adoption, find which of three stages is blocked (people never found the feature, tried it once, or did not come back), then apply the tactic for that stage and measure the number that stage owns. In the sample, lifting awareness, first try and repeat use together moves adopters from 720 to 1,350 of 10,000 eligible users, because the stage rates multiply. Below: the stage model, a blocker table, and a sample-size rule.
What you will learn
- Define adopted as behaviour (such as 3 or more uses in 30 days) among eligible users, then split it into awareness, trial and repeat use
- Pick each tactic by the stage it unblocks and check it against that stage's own metric
- Compare groups that started in the same week and know your margin of error before reading a change
What does it mean to increase product adoption?
Product adoption is the share of people who could use your product, or one of its features, and have started using it in a way that sticks. To make that number something you can improve, define "adopted" as an observable behaviour, not a feeling. A workable definition is a person who did the key action at least three times in 30 days. Then:
Adoption rate = people who reached the adopted state ÷ people eligible to use it
Google's HEART framework, published at CHI 2010 by Kerry Rodden, Hilary Hutchinson and Xin Fu, makes the same split: adoption metrics "track how many new users start using a product during a given time period", and retention metrics look at whether existing users keep coming. This guide is about the first of those, and about the less obvious second half of it, repeat use. Measuring adoption in the first place is covered in measure product adoption, and the feature-level version in feature adoption; this article is about what to change once you have the number.
The claim running through the rest of the page: adoption is blocked at one of three stages (never found it, tried it once and stopped, or used it and did not come back), and every tactic should be chosen by the stage it unblocks and checked against the metric that stage owns. A list of eight tactics without that mapping is just a to-do list.
Where in the journey are people getting stuck?
Split the journey into three stages, each with its own metric:
- Awareness: the eligible user reached the place where the feature is offered. Metric: share of eligible users who saw it.
- Trial: the user tried it at least once. Metric: share of aware users who tried.
- Repeat use: the user came back to it enough times to count as adopted. Metric: share of triers who reached the adopted state.
The product of the three rates is the adoption rate. That matters because a weak stage is easy to hide behind a strong one: a feature that 90% of users try can still have a 5% adoption rate if only 6% of triers come back. Each stage needs a different fix. Awareness is a placement problem. Trial is a value-and-friction problem. Repeat use is a habit and quality problem. Fixing the wrong stage costs weeks and moves nothing.
What does a worked example look like?
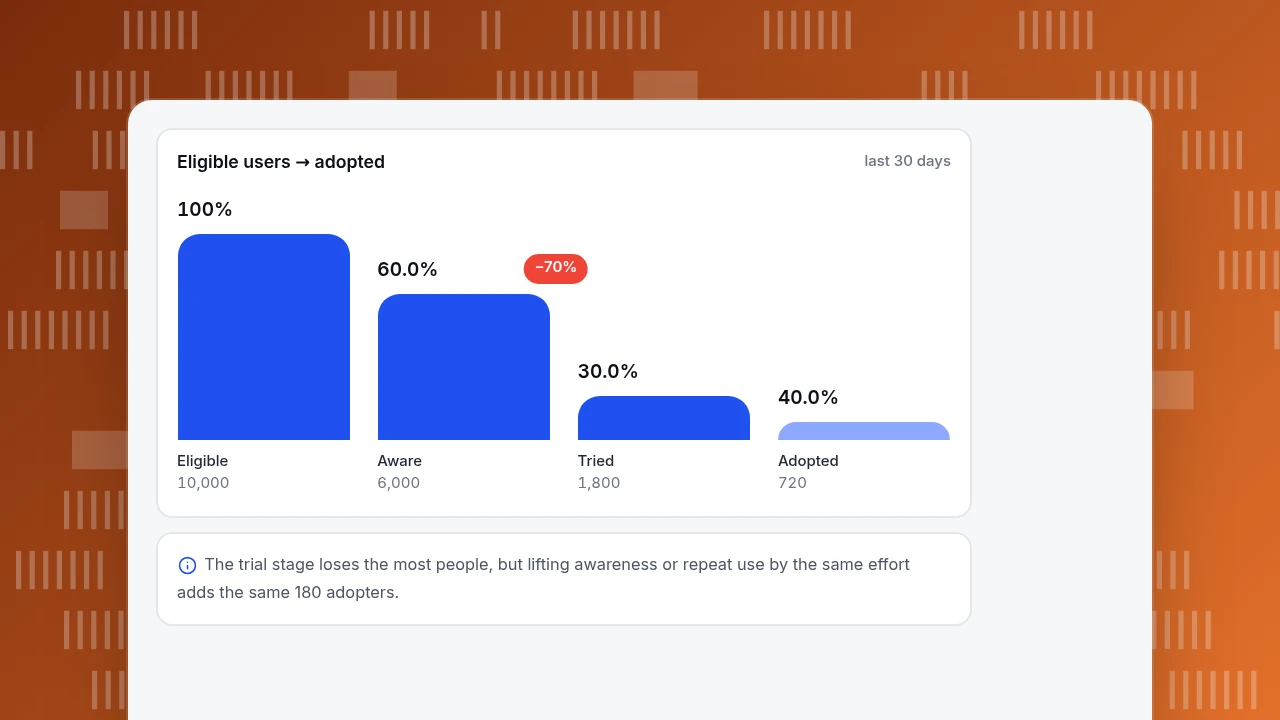
Sample data: a project tool has a new "recurring tasks" feature. In the last 30 days, 10,000 active accounts were eligible. The three stages:
| Stage | Users | Rate at this stage |
|---|---|---|
| Eligible | 10,000 | n/a |
| Aware (opened the task menu where the feature sits) | 6,000 | 60% of eligible |
| Tried (created one recurring task) | 1,800 | 30% of aware |
| Adopted (3 or more uses in 30 days) | 720 | 40% of tried |
Adoption rate: 720 ÷ 10,000 = 7.2%.
Now test where a fix is worth the most. Suppose a tactic can plausibly lift one stage and nothing else:
- Awareness from 60% to 75%: 10,000 × 0.75 × 0.30 × 0.40 = 900 adopters (+180).
- Trial from 30% to 36%: 6,000 × 0.36 × 0.40 = 864 adopters (+144).
- Repeat use from 40% to 50%: 6,000 × 0.30 × 0.50 = 900 adopters (+180).
- All three together: 10,000 × 0.75 × 0.36 × 0.50 = 1,350 adopters, which is 13.5%.
The three fixes are not equal in effort. The percentage-point lift in awareness is the cheapest to get (a better placement), which is why it often comes first. The numbers also show something people miss: every stage multiplies the next, so the combined 1,350 is more than the sum of the individual gains (720 + 180 + 144 + 180 = 1,224). Work on the cheapest stage first, but plan for the product of the three, not the sum.
Eligible users → adopted
last 30 daysEligible
10,000
Aware
6,000
Tried
1,800
Adopted
720
Which tactic goes with which blocker?
Use this table to turn a weak stage into a tactic and into the number that proves it worked. The proof metric is the part most teams skip.
| Blocker | Stage | Tactic | Proof metric |
|---|---|---|---|
| Users do not know the feature exists | Awareness | Offer it in context, at the moment the user would need it | Share of eligible users who saw the entry point |
| Users do not see the value | Trial | Show the outcome up front with a sample or template | Share of aware users who tried within 7 days |
| First use takes too many steps | Trial | Cut the first run to one action and prefill what you can | Median time from first seen to first use |
| A permission or setup prompt comes too early | Trial | Ask after the user does something that needs it | Grant rate for the prompt |
| It fails or confuses on first use | Trial | Fix the error and track failures on this feature | Error rate and affected users on this feature |
| Used once, no reason to return | Repeat use | Tie the next use to a natural moment | Share of triers with 3 or more uses in 30 days |
| Users cannot find help | Trial and repeat use | Put help or a chat entry on the feature screen | Questions about this feature per 100 new users |
| Wrong audience is counted | Any | Define eligibility; target the segment that needs it | Adoption among eligible users, not all users |
Two of these have a documented platform basis. On Android 13 (API level 33) and higher, a newly installed app's notifications are off by default until the user grants POST_NOTIFICATIONS, and Android's own guidance is to wait and ask in context: when the user taps an alert bell, follows an account or submits an order, or after the third or fourth launch. That is the "ask after the user does something that needs it" tactic with a source. The HEART paper's own example is a similar proof metric: a Google product found that using it on five or more days in the last week was strongly predictive of longer-term retention, so they used it as a bellwether.
| Stage | Question | Metric |
|---|---|---|
| Awareness | Did eligible users see it? | Share of eligible who saw the entry point |
| Trial | Did they try it? | Share of aware who tried |
| Repeat use | Did they come back? | Share of triers with 3 or more uses in 30 days |
The adoption rate is the product of the three stage rates.
How do you fix awareness?
Awareness problems are about where and when the feature is offered, not how loudly. Three rules:
- Offer it where the need appears. A recurring-tasks hint belongs on the screen where someone has just created the same task twice, not in a release-notes banner. Rank candidate placements by how many eligible users pass through them per week.
- Count exposure, not sends. An announcement that was delivered but scrolled past did not make anyone aware. The metric is the share of eligible users who saw it, which needs an event on the entry point.
- Stop after it worked. A person who has tried the feature should stop seeing the prompt. Prompts that never go away train users to ignore the whole product.
If exposure is already above 80% and adoption is still low, awareness is not the problem; move to trial.
How do you fix the first try?
Trial is lost to value and friction. Start with friction because it is measurable.
- Time the first run. Measure the time from the moment a user first saw the feature to their first use. If the median is two days, the feature is not hard to find; it is not compelling enough to try now.
- Count the steps to first value. Write down every tap between the entry point and the first success. Cut anything that is not required for the first success, and prefill the rest.
- Show the outcome first. A sample result or one-click template tells a user what they will get before they commit.
- Check the error rate. If 15 of 100 first attempts fail, no amount of messaging will help. Fix the failures first.
A good target is not a number; it is that the trial rate moves when you change one of these things and nothing else.
How do you make people come back?
Repeat use is the stage most guides skip, and in the example it is the largest lever: 1,800 people tried the feature and only 720 stayed. The tactics are about natural moments, not reminders:
- Tie the second use to something the user already does. If recurring tasks are most useful at the start of a week, the second use is more likely to happen on a Monday than a Wednesday.
- Make the result visible later. A feature whose payoff arrives only after a delay needs something that shows the payoff when it arrives.
- Look at who did not return. The people who tried and stopped are a defined group. Ask a few of them why, in support or in a chat, before you guess.
Do not count a user as adopted because they tried once. Use the same definition you started with, such as 3 or more uses in 30 days, and keep the definition fixed while you test changes.
How do you know a tactic worked?
Compare groups that started in the same period, not before and after. A change you ship in week 5 and measure against week 4 also measures any other change in those two weeks.
The second discipline is sample size. A rate measured on few users moves by chance. For an adoption rate of 7.2%, the 95% margin of error is about:
- 10,000 eligible users: ±0.51 percentage points (standard error 0.26 points, times 1.96).
- 2,000 eligible users: ±1.13 points.
- 1,000 eligible users: ±1.60 points.
So a move from 7.2% to 9.0% on 10,000 users in each group is a difference of 1.8 points, with a margin of ±0.76 points on the difference (z ≈ 4.7), which is solid. The same 1.8-point move on 1,000 users per group would not be, and you should not read a 0.3-point change on any of these sizes. Pick the minimum change you care about before the test, and wait until the margin is smaller than it.
What mistakes make adoption work fail?
- Counting all users as eligible. If a feature applies to 40% of accounts, adoption is measured against that 40%.
- Calling a click "adoption". The first use shows interest. Adoption is the repeated behaviour.
- Changing several things at once. You will not know which of the three stages moved.
- Mistaking announcements for exposure. An email that was sent is not an exposure; a screen that was seen is.
- No stop condition. Decide in advance when you stop pushing a feature that is not being adopted. Some features simply do not matter to many users.
How to do it with TapCub
Take the recurring-tasks example. The measuring is the part TapCub does; the changing is yours. TapCub does not show in-app tours, checklists or tooltips, and it does not run A/B experiments; it reports what users did.
- In All-platform analytics › Data › Tracking plan, define the three events: the entry point seen (for example
recurring_menu_viewed), the first creation and the repeat action. Each event gets a name, platform, trigger and owner, so everyone reads the stages the same way. - In All-platform analytics › Behavior › Behavior analysis, build a funnel from entry seen to first creation. The step that loses the most people is the stage to fix first, and the funnel can be split by a segment.
- Still in Behavior analysis, use the distribution of the creation event to see how many times each person fired it. The share with three or more is your adoption rate, and the share with exactly one is the group that tried and stopped.
- In All-platform analytics › Users › Segments & tags, save a rule segment "did the event once, did not do it again" so the group is the same on every chart and you can look at their profiles. Anonymous visitors have no profile and are never segment members, so this works for identified users.
- After each change, mark the release date in Configuration › Annotations so you can see the before and after on the same chart, then compare groups that started in the same week as the proof section recommends.
If people ask questions about the feature, the questions arrive in Live chat › Inbox with the page they were on, which turns "Users cannot find help" from a guess into a count.
FAQ
How do you increase product adoption?
Find which of three stages is blocked (awareness, first try or repeat use), pick the tactic for that stage and measure the metric that stage owns. In the sample, lifting awareness, trial and repeat use together raises adopters from 720 to 1,350 of 10,000 eligible users, because the stage rates multiply.
What is a good product adoption rate?
No universal figure exists, because it depends on how you define "adopted" and who is eligible. Decide your own definition, for example 3 or more uses in 30 days among eligible users, record the current rate and judge changes against it, not against another company's number.
What is the difference between product adoption and feature adoption?
Product adoption is whether people use the product in a lasting way; feature adoption is the same question for one feature among users who could use it. The three-stage method works for both: change what counts as eligible and as adopted.
How long does it take to see adoption improve?
It depends on how fast your eligible users reach the feature. A sample of 10,000 eligible users gives a margin of about 0.5 percentage points on a 7.2% rate, so measure for long enough to gather that many users, and judge groups that started in the same week.
Why is awareness not enough?
Because the stages multiply. If 75% of users see a feature but only 36% of them try it and half of those come back, adoption is 10,000 × 0.75 × 0.36 × 0.50 = 1,350, not 7,500. A strong awareness number can hide a weak stage after it.
Sources
- Kerry Rodden, Hilary Hutchinson and Xin Fu. Measuring the User Experience on a Large Scale: User-Centered Metrics for Web Applications. Proceedings of CHI 2010 — the HEART framework and its adoption and retention definitions. Checked 2026-11-20.
- Android Developers. Notification runtime permission — notifications off by default from Android 13; ask in context. Checked 2026-11-20.
Was this article helpful?
We use your answers to fix and expand this page.
Couldn’t send. Please try again in a minute.
Thanks for the feedback. We’ll use it to improve this page.You’ve already sent feedback on this page. Thanks.

Product Experience Specialist
Writes about product experience, practical workflows, and growth, turning complex processes into clear steps for everyday decisions.