Try it on your own data
Every report in this article is in the free plan. One snippet for web and apps, up to 10 sites.
Start freeTo increase monthly active users, pull one of three levers, because MAU = retained + new + resurrected: keep more of last month's users, activate more new ones, or bring back lapsed ones. In the sample, +3 points of retention, +15% activation and a 1-point win-back lift take MAU from 83,000 to 91,200, and retention keeps paying next month. Below: nine tactics mapped to their lever, the uplift maths and the traps.
What you will learn
- Every MAU tactic pulls one of three levers: retained, new or resurrected users; name the lever before you pick the tactic
- Retention compounds into next month; a new-user gain of the same size does not
- Define active by a core action and read DAU divided by MAU to see whether growth is habit or reach
What moves monthly active users?
Monthly active users (MAU) is the number of different people who were active at least once in a month, so it can only change in three ways. Every active person this month is one of these:
MAU = retained + new + resurrected
- Retained: active last month and active again this month.
- New: first active this month.
- Resurrected: active some time before, but not last month, and back this month.
That identity is the whole reason "how to increase MAU" has a short answer: pull one of those three levers, and know which one each tactic pulls. The glossary entry on monthly active users covers the definition; this guide covers what to do about it. Two points the identity makes clear. First, MAU counts people, not visits, so a tactic that makes the same people open the app more often does nothing to MAU. Second, retention carries forward: a person retained this month is in next month's retained pool, so a retention gain compounds where a new-user gain does not. How to keep people once they arrive is its own subject in user retention strategies.
Which lever does each tactic pull?
| Tactic | Lever | Proof metric |
|---|---|---|
| Cut steps to the first useful result | New (activation) | Share of new users doing the core action within 7 days |
| Ask for notification permission after the user does something that needs it | Retained, resurrected | Opt-in rate on the prompt |
| Build a weekly reason to return, such as scheduled content or digests | Retained | Month-2 retention of each new cohort |
| Fix crashes and slow screens on the core flow | Retained | Crash-free users and core-flow completion |
| Message lapsed users who opted in, with something new for them | Resurrected | Reactivation rate of the lapsed group |
| Put an invite or share step inside the core flow | New | Invites sent per 100 active users, and invited-user activation |
| Improve the channels that bring installs | New | Install-to-active rate by channel |
| Email or message users who stalled before their first core action | New (activation) | Share of stalled users who then reach the core action |
| Add a second use case for existing users | Retained | Share of active users using two or more features |
Pick tactics by the lever with the most room, which the next section shows how to find. Do not run all nine at once: you will not know which one moved the number.
| Lever | What it counts | Typical proof metric |
|---|---|---|
| Retained | Active last month and again this month | Month-over-month retention of the cohort |
| New | First active this month | Install-to-active rate |
| Resurrected | Active earlier, absent last month, back now | Reactivation rate of the lapsed group |
MAU is the sum of the three; DAU divided by MAU shows frequency.
What does a worked MAU uplift look like?
Sample data: an app had 100,000 active users last month. Rates are measured on that population.
| Component | Calculation | Users |
|---|---|---|
| Retained | 100,000 × 60% | 60,000 |
| New | installs this month that became active | 18,000 |
| Resurrected | 250,000 lapsed users × 2% | 5,000 |
| MAU this month | 60,000 + 18,000 + 5,000 | 83,000 |
Now see what one lever is worth, holding the others at baseline:
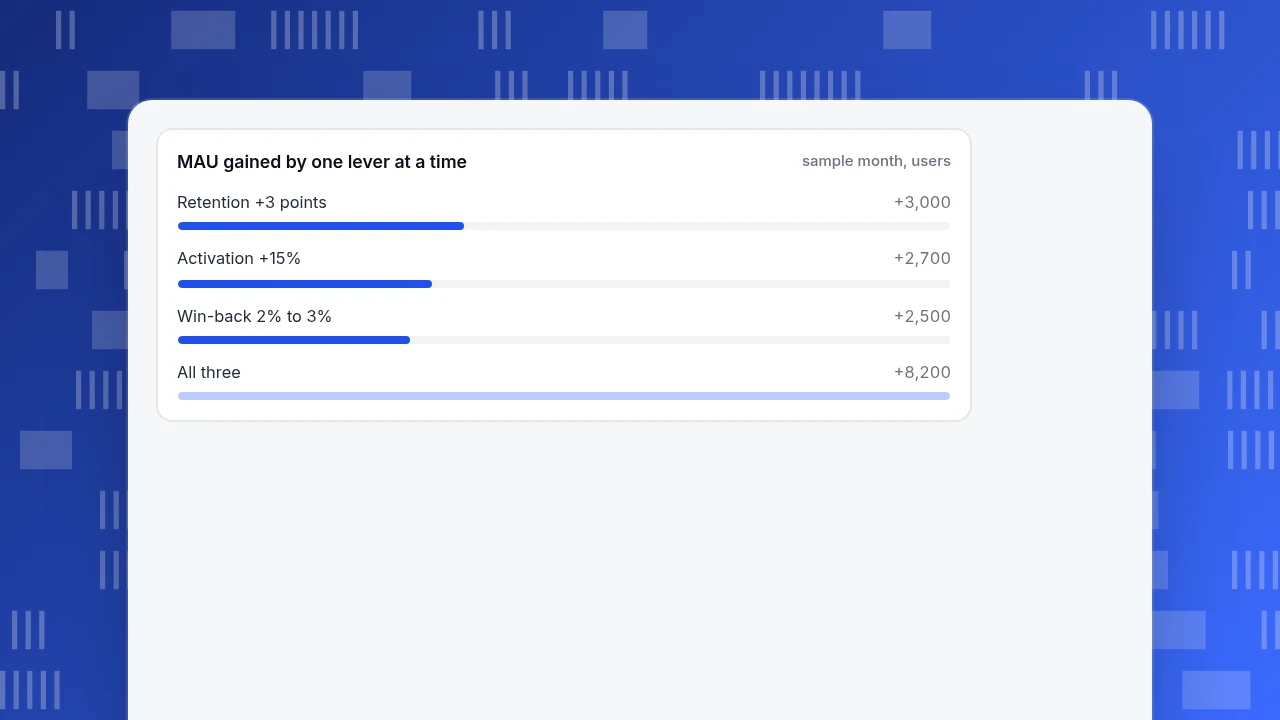
- Retention up 3 points (60% to 63%): 100,000 × 3% = +3,000 MAU, a 3.6% rise.
- Activation up 15% (18,000 to 20,700 new active users): 18,000 × 15% = +2,700, a 3.3% rise.
- Win-back from 2% to 3% of 250,000: 250,000 × 1% = +2,500, a 3.0% rise.
- All three: 83,000 + 3,000 + 2,700 + 2,500 = 91,200, a 9.9% rise.
The three look similar in size, so the choice comes down to cost and speed. But the effects do not last equally. Next month the larger base is retained at the new retention rate: 91,200 × 63% = 57,456 retained, against 83,000 × 60% = 49,800 in the baseline, a gap of 7,656 from retention alone, before any new users. Retention is the lever whose payoff grows.
MAU gained by one lever at a time
sample month, usersHow does MAU relate to how often people use the app?
MAU hides frequency, so read it next to daily actives. A public example helps. Duolingo's Q3 2025 shareholder letter reports 135.3 million MAU and 50.5 million daily active users (DAU), against 113.1 million and 37.2 million a year earlier. Duolingo defines MAUs as unique users who engage with its app or the learning section of its website each month, and the quarterly figure is the average of the three monthly numbers.
From those reported numbers, calculated here (the letter does not state the ratio):
- MAU grew 135.3 ÷ 113.1 − 1 = 19.6% (the letter says 20%).
- DAU grew 50.5 ÷ 37.2 − 1 = 35.8% (the letter says 36%).
- DAU ÷ MAU rose from 37.2 ÷ 113.1 = 32.9% to 50.5 ÷ 135.3 = 37.3%.
Daily actives grew almost twice as fast as monthly actives, which means the same people used the product more often, not just that more people joined. A team that tracked only MAU would see 20% growth and miss that most of the improvement was in frequency. If your goal is MAU, track DAU ÷ MAU as a check on whether the base you are growing is a habit or a trickle.
Which definition of "active" should you use?
The word "active" decides your MAU, and a loose definition inflates it. Using the sample app:
- Opened the app: 83,000 MAU.
- Did the core action (for example sent a message, completed a lesson or placed an order): suppose 55% of those who opened did it, which gives 83,000 × 55% = 45,650 MAU.
Both numbers are true, and they answer different questions. The first measures reach; the second measures use. A tactic like a push notification can raise "opened" without raising "did the core action", so a team that optimises the loose number can be pleased by a change that did nothing for the product. Pick the definition that matches the value your product delivers, write it down, and do not change it mid-test. If you change it, restate the history.
Which tactics should you try first?
Use the table and example to choose in this order:
- Find the lever with the most room. Look at the example: if only 2% of lapsed users return, there is more room in win-back than in a product that already retains 85% of its users.
- Prefer retention work when the numbers are close, because it compounds into next month. Spend on acquisition only when activation is healthy; otherwise new installs flow into a leaky bucket.
- Fix breakage before adding campaigns. If the core flow crashes for a share of users, no campaign fixes that. Android's vitals treat a user-perceived crash rate above 1.09% of daily users as bad behaviour, which is a useful ceiling to stay under.
- Ask for permissions in context. On Android 13 and higher, a newly installed app's notifications are off by default until the user grants
POST_NOTIFICATIONS; Android's guidance is to ask after the user does something that needs it, such as tapping an alert bell, following someone or submitting an order, or after the third or fourth launch. A win-back plan that depends on push is limited by that opt-in rate, so measure it before you plan around it. - Change one thing per cohort. Each tactic gets its own start date and a cohort that began in the same week, so the effect is attributable.
What goes wrong when teams chase MAU?
- Counting installs as active. Installs measure acquisition, not use; an install that never opened is not in MAU.
- Spending on acquisition into a low-retention base. A new user who leaves in the first week adds to MAU for one month only.
- Sending more messages to the people already active. They are already counted. Target the lapsed and stalled groups.
- Reading a single month. Month-to-month noise is real; compare the same cohort across months.
- Mixing definitions. If "active" changed in March, the March jump is a definition change, not growth.
How to do it with TapCub
The worked example splits MAU into retained, new and resurrected. TapCub shows that split directly, and tells you which of the three needs work. TapCub does not send push notifications, emails or in-app messages, so the changes themselves stay in whatever tool you use; TapCub measures whether they worked.
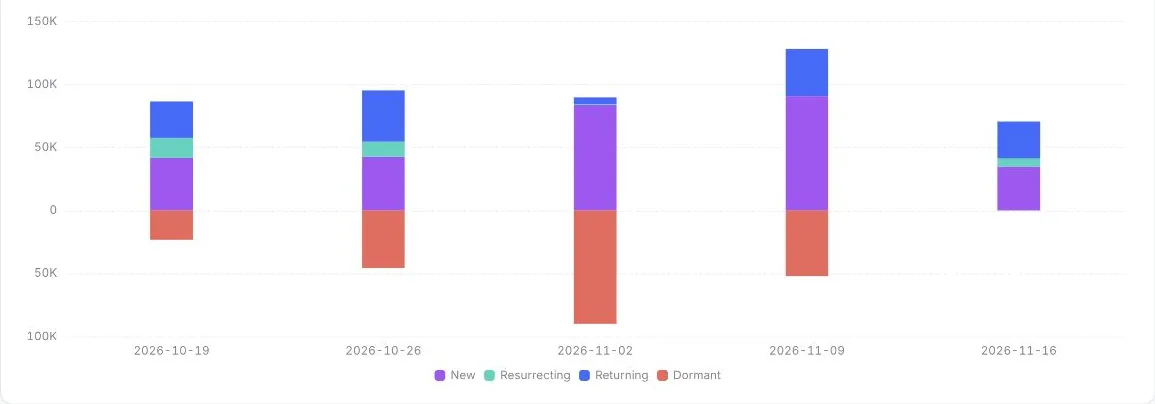
- Open All-platform analytics › Behavior › Behavior analysis and choose the lifecycle view by month. It shows four counts per month: New (first appearance in the month), Returning (also active in the previous month), Resurrecting (active earlier but not last month) and Dormant (active now, absent next month, drawn as a negative on the next month). The first three add up to that month's active people.
- Compare the three components month over month. A shrinking Returning bar is a retention problem; a small Resurrecting bar is a win-back problem; a small New bar is acquisition or activation.
- In the same area, use the retention view to see whether people are still active on day 7 and day 30 after their first action, split by cohort. For mobile apps, App analytics › Users › Retention shows the same for the app.
- In All-platform analytics › Users › Segments & tags, save a rule segment such as "active before, not active in the last 30 days" for your win-back list. Segments only contain identified users; anonymous visitors have no profile.
- After each change, add an annotation in Configuration › Annotations so the lifecycle chart shows when it happened.
If you want the event for the core action and the definition of "active" written down in one place, All-platform analytics › Data › Tracking plan is where they are recorded.
FAQ
How do I increase monthly active users?
Pull one of three levers: retain more of last month's users, activate more new ones, or bring back lapsed ones. In the sample, +3 points of retention, +15% activation and a 1-point win-back lift take MAU from 83,000 to 91,200, and retention keeps paying next month.
What is a good MAU growth rate?
It depends on your stage and product, so there is no safe general figure. A public data point: Duolingo reported MAU up 20% year over year in Q3 2025 with DAU up 36%. Compare your own growth month over month on the same definition of active.
What is the difference between MAU and DAU?
MAU counts different people active in a month; DAU counts different people active in a day. DAU ÷ MAU shows how often the monthly base returns: in the Duolingo example it rose from 32.9% to 37.3%, so frequency grew faster than the base.
Do push notifications increase MAU?
They can, if users opted in and the message gives them a reason to return. On Android 13 and higher notifications are off for new installs until the user allows them, so your reach is limited by the opt-in rate. Ask in context and measure the opt-in rate first.
Why did MAU rise but the business didn't improve?
Possibly because "active" is defined loosely. In the sample, 83,000 people opened the app but only 45,650 did the core action. Track a core-action definition alongside the open-based one, so you can tell reach from use.
Sources
- Duolingo, Inc. Third quarter 2025 shareholder letter (SEC Form 8-K exhibit) — DAU 50.5M and MAU 135.3M vs 37.2M and 113.1M; MAU definition. Checked 2026-11-20.
- Android Developers. Notification runtime permission — notifications off by default from Android 13; ask in context. Checked 2026-11-20.
- Google Play Console Help. Android vitals bad behavior thresholds — 1.09% user-perceived crash rate. Checked 2026-11-20.
Was this article helpful?
We use your answers to fix and expand this page.
Couldn’t send. Please try again in a minute.
Thanks for the feedback. We’ll use it to improve this page.You’ve already sent feedback on this page. Thanks.

Data Analyst
Explores traffic sources, conversion funnels, and retention, using clear metric definitions and concrete examples to explain what the numbers mean.