Try it on your own data
Every report in this article is in the free plan. One snippet for web and apps, up to 10 sites.
Start freeBad UX is any pattern that makes people work harder, wait longer or give up, and the ones worth hunting leave a trace in behaviour data: slow loads, layout shift, laggy taps, errors, 404 dead ends, forced accounts, late costs, long forms, dead-looking buttons and broken phone layouts. Below, each is paired with the signal that exposes it and the threshold that justifies a fix.
What you will learn
- Pair every bad UX pattern with a signal: Core Web Vitals, error rate, a funnel step, repeated clicks or a device gap
- Rank fixes by people affected times the fraction a fix could recover, not by how bad the page looks
- Some problems, such as low contrast, need an audit because analytics barely sees them
What counts as bad UX, and how can analytics show it?
Bad UX is any design or technical pattern that makes people work harder, wait longer or give up, and the useful ones to hunt are those that leave a measurable trail in behaviour data. Opinions about a design are cheap to argue; a step where 40% of visitors vanish is not.
Each pattern below is paired with the signal that exposes it and the threshold that makes it worth fixing. Where the evidence comes from outside this site, it is cited at the end: Google's web.dev for speed and stability thresholds, the Baymard Institute for why shoppers abandon checkouts, and WebAIM and the W3C for accessibility. The measurement side, covering which numbers to track at all, is in UX metrics, and the wider question of friction is in user friction; this page is the pattern-to-signal lookup.
Which ten bad UX patterns can you detect from data?
| # | Bad UX pattern | Signal that exposes it | Threshold or benchmark |
|---|---|---|---|
| 1 | Slow main content | Largest Contentful Paint at the 75th percentile | Good: 2.5 s or less |
| 2 | Layout that jumps while loading | Cumulative Layout Shift | Good: 0.1 or less |
| 3 | Taps and clicks that lag | Interaction to Next Paint | Good: 200 ms or less |
| 4 | Script errors and broken pages | Error rate (errors ÷ pageviews), sessions affected | Baymard: 17% of abandoning shoppers cite site errors or crashes |
| 5 | Dead ends (404 pages) | 404 hits and the previous page that sent them | Any page that sends people to a 404 repeatedly |
| 6 | Forced account creation | Funnel drop at the account step | Baymard: 18% cite required account creation |
| 7 | Costs revealed late | Funnel drop at the step where totals appear | Baymard: 40% cite extra costs too high, 12% not seeing total cost up front |
| 8 | Long or complicated forms | Step completion rate and time to complete | Baymard: 17% cite a long or complicated checkout |
| 9 | Elements that look clickable but do not respond | Repeated clicks on the same element | A cluster on a non-interactive element |
| 10 | Layout that fails on phones | Conversion or bounce gap between device types after controlling for source | A gap that persists inside one source |
The thresholds in rows 1 to 3 come from Google's Core Web Vitals, which are assessed at the 75th percentile of page loads: the page passes only if all three metrics meet their targets at that percentile. The shopper figures in rows 4 to 8 are Baymard's reported reasons for abandonment; they say why people left, not how many left at each step on your site, which is what the funnel in the worked example below measures.
| Bad UX pattern | Signal | Threshold |
|---|---|---|
| Slow main content | LCP at 75th percentile | 2.5 s or less |
| Layout shift | CLS | 0.1 or less |
| Laggy taps | INP | 200 ms or less |
| Errors | Error rate, sessions affected | Baymard: 17% cite errors |
| Forced account | Funnel drop at account step | Baymard: 18% |
| Late costs | Funnel drop at total step | Baymard: 40% |
| Long forms | Step completion and time | Baymard: 17% |
Thresholds from Google web.dev; shopper shares are Baymard's reported abandonment reasons.
What do speed and stability problems look like in data?
Patterns 1 to 4 are measurable without any interpretation, because the browser reports them.
- Slow content (1) and lag (3). Look at the 75th-percentile value, not the average, and split by device. A page can pass on desktop and fail on phones. If LCP is 3.4 s on mobile and 1.9 s on desktop, the fix is mobile images and scripts, not the whole site.
- Layout shift (2). CLS over 0.1 typically comes from images without dimensions, late-loading banners or fonts. Users feel it as a button moving just as they tap.
- Errors (4). Count the error rate as errors ÷ pageviews and the number of sessions affected. Ten thousand errors from one script on one browser version is one bug, not ten thousand.
Check the performance numbers on the slice that bounces (a source and device pair), not on the whole site; the method for finding that slice is in bounce rate analysis.
What do checkout and form problems look like?
Patterns 6 to 8 do not show up in browser metrics. They show up as a step in a funnel where the conversion rate falls well below its neighbours.
Baymard's documented average cart abandonment rate is 70.22%, the mean of 50 studies from 2006 to 2025. Among shoppers who abandoned for reasons other than just browsing, Baymard's survey lists extra costs too high at 40%, delivery too slow at 20%, not trusting the site with card details at 19%, required account creation at 18%, a long or complicated checkout at 17%, website errors at 17%, and not being able to see the total cost up front at 12%.
Two readings follow. First, most of these are layout and policy choices you control. Second, each maps to a different funnel symptom:
- Costs revealed late: sharp drop at the step where shipping and tax appear.
- Account wall: sharp drop at the step that asks for a password.
- Complicated checkout: gradual loss across many steps, and a long median time to complete.
- Errors: drop that concentrates on one browser or device, with matching error counts.
Worked example: finding the broken step in a checkout
Sample data: an online store, 10,000 cart views in a month.
| Step | People | Step conversion | Lost at this step |
|---|---|---|---|
| Cart viewed | 10,000 | n/a | n/a |
| Checkout started | 7,000 | 70.0% | 3,000 |
| Shipping and total shown, continued | 4,200 | 60.0% | 2,800 |
| Payment submitted | 3,500 | 83.3% | 700 |
| Order placed | 3,150 | 90.0% | 350 |
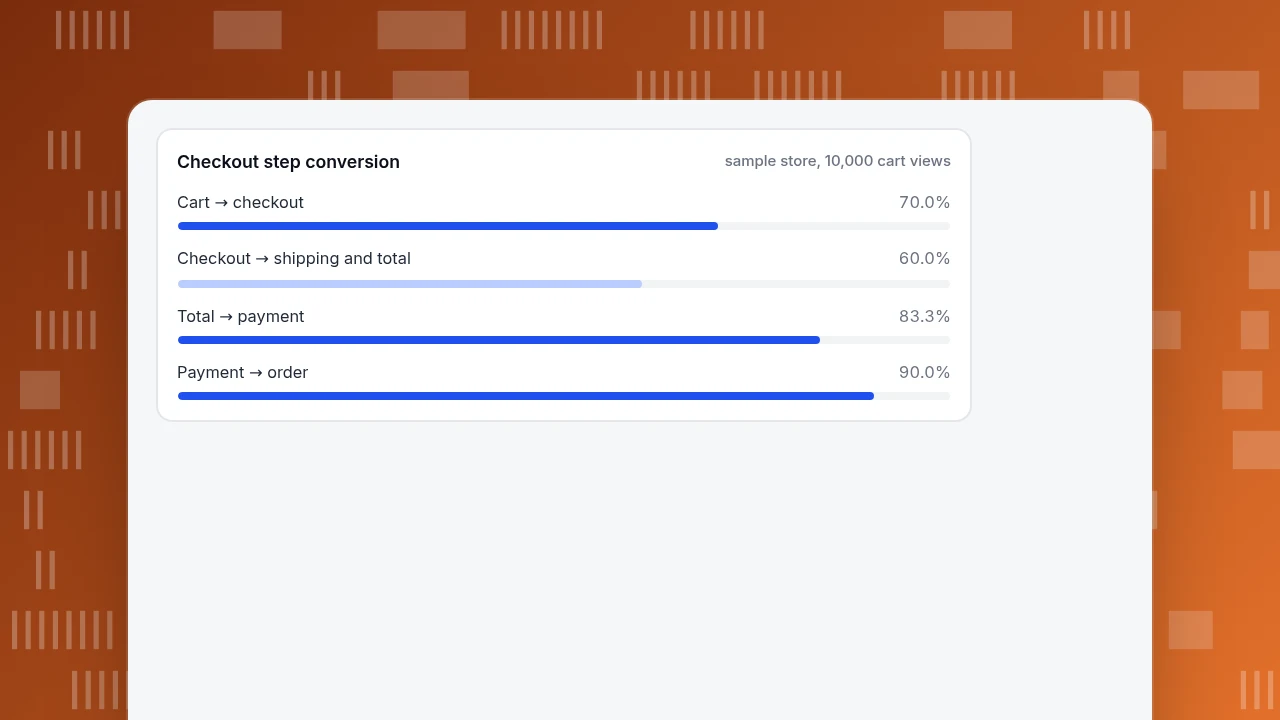
End to end, 3,150 ÷ 10,000 = 31.5% of cart views become orders, so 68.5% abandon, close to Baymard's 70.22% average. The average hides the shape: the step where shipping and the total appear converts at 60.0%, lower than every step after it, and it matches the "costs revealed late" pattern.
Suppose a fix (showing an estimated total in the cart) lifts that step from 60% to 70%. Then: 7,000 × 70% = 4,900; × (3,500 ÷ 4,200) = 4,083; × 90% = 3,675 orders, against 3,150 now. That is +525 orders (+16.7%), and at a sample average order of $60 it is $31,500 a month. The size of the gain is an assumption to test; the step you test it on is not a guess.
The same funnel would not tell you if the step's loss is concentrated on mobile. That is why the next check is a split by device: if mobile is 45% and desktop 72% at that step, you have two problems, a cost surprise and a mobile layout issue.
Checkout step conversion
sample store, 10,000 cart viewsWhich patterns can't analytics see?
Some bad UX leaves no behavioural trail until it is severe, and needs an audit instead:
- Low contrast and small targets. WCAG 2.2 requires a contrast ratio of at least 4.5:1 for normal text (3:1 for large text). WebAIM's February 2026 analysis of the top one million home pages found low-contrast text on 83.9% of them, missing image alternative text on 53.1%, unlabeled form inputs on 51%, and detectable WCAG 2 failures on 95.9%, averaging 56.1 errors per page.
- Confusing wording or navigation. Analytics shows people leaving, not that they misread a label. Pair a drop with a short usability test or session recordings.
- Trust and tone. Baymard's 19% who did not trust the site with card details will not appear as a click pattern at all.
Treat these as a checklist you run once a quarter, and use the data patterns as the continuous alarm.
How should you prioritise what to fix?
Rank by the people the problem affects times the fraction you could recover, not by how embarrassing it looks.
- People affected = visitors who reach the step or page.
- Drop gap = how far the step's conversion is below a comparable step or a benchmark.
- Recoverable = people affected × the gap you think a fix closes, as a range, not a point.
- Effort = rough days of work.
In the example, closing 10 points of a 7,000-person step is 700 people, then × 0.83 × 0.90 = 525 orders. A second issue affecting 300 people with the same relative gap loses to it even if it is easier to fix. Do the high-impact fix first and the cheap ones in parallel.
How do you look for these patterns in TapCub?
Take the checkout example. In TapCub:
- Build the funnel. In All-platform analytics › Behavior › Behavior analysis, create a funnel with your steps (page paths or event names, 2 to 20 steps) and a conversion window; it shows people at each step, where they drop and how long completion takes. Break down by device (first layer, top 10 groups).
- Check performance and errors on the weak step. Monitoring › Performance shows real-user Core Web Vitals; Monitoring › Errors shows error rate, affected visitors and sessions, and each error group with its page and device.
- See where people click. In All-platform analytics › Behavior › Heatmaps use the Clicks, Rage clicks, Scroll reach and Elements tabs for the page and device. This needs autocapture, which needs the Pro plan or higher; session replay, if you turn it on, is off by default.
- Find dead ends. In Web analytics › Pages, the 404 tab lists hits and the previous page that sent them.
- Mark the release. Put the fix on Configuration › Annotations and re-run the same funnel.
TapCub does not run A/B tests or split traffic: you compare before and after, and treat a lift as an estimate until the next period confirms it. It also does not audit colour contrast.
FAQ
What are examples of bad UX?
Slow pages, layouts that shift while loading, laggy taps, script errors, 404 dead ends, forced account creation, costs revealed at the last step, long forms, elements that look clickable but are not, and layouts that break on phones. Each of these has a measurable signal, listed in the table above.
How can you tell if a website has bad UX?
Look for a step where conversion is far below its neighbours, a device or browser where results are much worse after controlling for source, and error or slow-load numbers above the thresholds (LCP 2.5 s, INP 200 ms, CLS 0.1 at the 75th percentile). Then confirm with heatmaps or recordings.
Why do people abandon checkout?
Baymard reports extra costs too high (40%), slow delivery (20%), distrust of card handling (19%), required account creation (18%), a long or complicated checkout (17%) and site errors (17%) as leading reasons, with a 70.22% average abandonment across 50 studies.
Is bad UX the same as bad design?
No. A design can look dated and still work, and a polished one can fail because it loads slowly or hides costs. Bad UX is judged by what people can do and how long it takes, which is why the signals here are behavioural.
How often should you check for these patterns?
Review the funnel, performance and error numbers weekly or after each release, and run the audit-type checks (contrast, labels, wording) quarterly. Compare the same filtered view before and after each fix.
Sources
- Baymard Institute. Cart Abandonment Rate Statistics — 70.22% average across 50 studies and the reasons shoppers gave. Verified 2026-11-20.
- web.dev. Web Vitals — assessment at the 75th percentile; LCP 2.5 s, INP 200 ms, CLS 0.1. Verified 2026-11-20.
- WebAIM. The WebAIM Million — February 2026 analysis of 1,000,000 home pages. Verified 2026-11-20.
- W3C. Web Content Accessibility Guidelines 2.2, SC 1.4.3 — contrast ratio of at least 4.5:1 (3:1 for large text). Verified 2026-11-20.
Was this article helpful?
We use your answers to fix and expand this page.
Couldn’t send. Please try again in a minute.
Thanks for the feedback. We’ll use it to improve this page.You’ve already sent feedback on this page. Thanks.

Technical Engineer
Focuses on tracking code, SDKs, and API integrations, with practical guidance on implementation checks and troubleshooting.