Try it on your own data
Every report in this article is in the free plan. One snippet for web and apps, up to 10 sites.
Start freeBehavioral segmentation variables are the observed actions used to group customers: recency, frequency, monetary value, usage depth, interest, occasion, journey stage and acquisition response. Action-based variables usually separate buyers better than source does: in a sample of 12,000 users, recency's best band converted 7.5 times better than its worst, against 2.0 times for acquisition source. Below, each variable has a sample segment rule.
What you will learn
- Pick variables by how well their best band beats their worst on the outcome, not by how easy they are to build
- Check overlap: a second variable is worth adding only if rates still differ inside each band of the first
- Write each segment as a rule that fits one sentence and attach a different action to each
What are behavioral segmentation variables?
Behavioral segmentation variables are the observed actions you use to split customers into groups: when they last acted, how often, how much they spend, how deeply they use the product, what they look at, when they buy, where they are in the journey and which campaigns they respond to. Unlike age or location, each one is something a person did, so it can change from week to week and the segment moves with it.
The textbook categories are narrower than what analytics data offers. OpenStax's Principles of Marketing describes behavioral bases such as benefit (which features matter to the customer), occasion (when people buy) and usage (non-, light, medium and heavy users), and notes the Pareto idea that 80 percent of revenue comes from the top 20 percent of repeat customers. Analytics adds recency, frequency and monetary value, journey stage and acquisition response. For the concept itself, see behavioral segmentation; this page is the variable catalogue and how to choose among them.
Which eight variables can you build segments from?
| # | Variable | What it measures | Sample segment definition |
|---|---|---|---|
| 1 | Recency | Time since the last action | Did Purchase in the last 90 days AND did not do Purchase in the last 30 days (lapsing buyers) |
| 2 | Frequency | How often in a window | Did Visit 4 or more times in the last 30 days |
| 3 | Monetary value | Revenue per person | Total order value in the last 180 days of $200 or more |
| 4 | Usage depth | How much of the product is used | Did Report exported 3 or more times in the last 30 days |
| 5 | Interest (benefit sought) | Which content or category is viewed | Viewed pages under /pricing at least twice AND no sign-up |
| 6 | Occasion and timing | When the action happens | Purchased in the last holiday week of the previous year |
| 7 | Journey stage | New, returning, resurrecting or dormant | First seen in the last 7 days AND did not do Sign-up completed |
| 8 | Acquisition response | Which campaign or channel produced the action | Arrived from the newsletter AND did Purchase |
Variables 1 to 3 are the RFM trio. Fader, Hardie and Lee's 2005 paper in the Journal of Marketing Research ties recency, frequency and monetary value to customer lifetime value; it treats them as inputs to a model of how much a customer is worth over time, not as three independent labels.
| Variable | What it measures | Sample segment definition |
|---|---|---|
| Recency | Time since the last action | Bought in last 90 days and not in last 30 |
| Frequency | How often in a window | 4 or more visits in last 30 days |
| Monetary value | Revenue per person | Order total of $200 or more in 180 days |
| Usage depth | How much of the product is used | Exported a report 3 or more times in 30 days |
| Interest | Which content or category is viewed | Viewed /pricing twice and did not sign up |
| Occasion | When the action happens | Bought in last year's holiday week |
| Journey stage | New, returning, resurrecting, dormant | First seen in 7 days and not signed up |
| Acquisition response | Which channel produced the action | Arrived from the newsletter and bought |
Definitions are examples; replace the event names with the ones you send.
What data does each variable need, and what is the usual trap?
A variable is only as good as the event behind it. Before building a segment, check that the event is sent reliably and tied to a person.
| Variable | Data you need | Usual trap |
|---|---|---|
| Recency | A timestamped event for the action that matters (purchase, not just visit) | Using "last visit" for a buying decision; a visit is not a purchase |
| Frequency | The same event counted over a fixed window | Comparing a 30-day count for new users with an old user's count |
| Monetary value | Revenue sent as a property on the purchase event | Mixing refunds, currencies or tax-inclusive and exclusive values |
| Usage depth | Events for the features that predict value | Counting every click as usage, so heavy users are just noisy clickers |
| Interest | Page or content category as a property | Treating one pageview as a stated preference |
| Occasion | An event date plus last year's data | Comparing a promotion week with a normal week and calling it a habit |
| Journey stage | First-seen date and recent activity | Counting people who changed browser as new users |
| Acquisition response | Channel or campaign stored on the person at first touch | Re-labelling someone by their most recent channel and losing the first one |
Two practical rules follow. First, fix the window before you compare (30 days for everyone, not "since signup"). Second, write down the event name and property each variable uses, so a later change to the tracking does not silently change the segment.
Which variables separate buyers best? A worked example
Sample data: 12,000 identified users, 600 of whom purchased in the next 30 days, so the base conversion rate is 600 ÷ 12,000 = 5.0%. Compare four variables, each cut into three bands:
| Variable | Band | Users | Purchased | Rate |
|---|---|---|---|---|
| Recency | Active in last 7 days | 2,400 | 288 | 12.0% |
| Recency | 8 to 30 days | 3,600 | 216 | 6.0% |
| Recency | More than 30 days | 6,000 | 96 | 1.6% |
| Frequency (30 days) | 1 visit | 7,200 | 144 | 2.0% |
| Frequency (30 days) | 2 to 3 visits | 3,000 | 216 | 7.2% |
| Frequency (30 days) | 4 or more | 1,800 | 240 | 13.3% |
| Usage depth | No feature use | 6,000 | 120 | 2.0% |
| Usage depth | 1 to 2 uses | 4,200 | 252 | 6.0% |
| Usage depth | 3 or more | 1,800 | 228 | 12.7% |
| Acquisition response | Newsletter | 1,500 | 120 | 8.0% |
| Acquisition response | Organic | 6,000 | 300 | 5.0% |
| Acquisition response | Paid | 4,500 | 180 | 4.0% |
Each variable's bands add back to 12,000 users and 600 purchases. The ratio of the best band's rate to the worst band's rate measures how well it separates buyers:
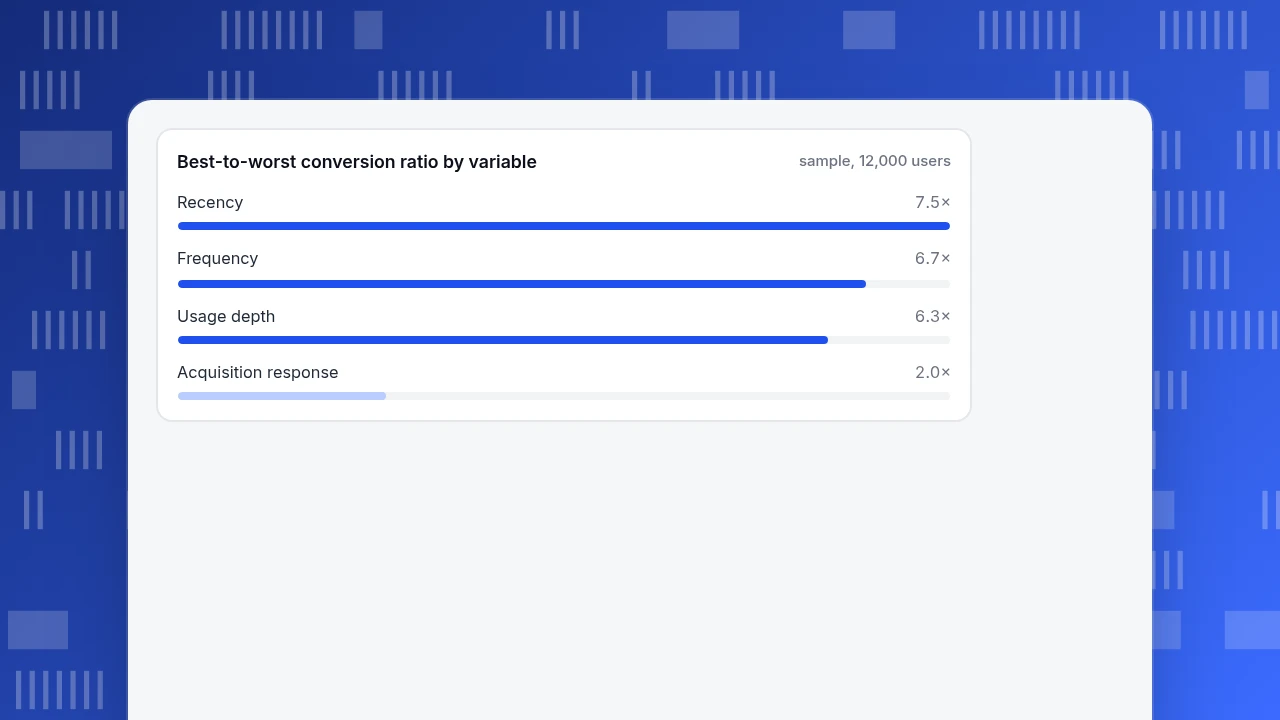
- Recency: 12.0% ÷ 1.6% = 7.5
- Frequency: 13.3% ÷ 2.0% = 6.7
- Usage depth: 12.7% ÷ 2.0% = 6.3
- Acquisition response: 8.0% ÷ 4.0% = 2.0
The three action-based variables separate buyers three times better than acquisition response, which fits the idea that what people do predicts what they do next better than where they came from. A ratio of 2.0 is not useless, though: newsletter users at 8.0% are worth a different message even if source does not rank them well.
Best-to-worst conversion ratio by variable
sample, 12,000 usersDo the variables overlap?
Yes, and stacking them blindly double-counts. Recency and frequency are correlated: people who visited in the last week are likelier to have visited several times. Test whether a second variable adds information inside the first:
| Inside "active in last 7 days" | Users | Purchased | Rate |
|---|---|---|---|
| 4 or more visits | 1,000 | 190 | 19.0% |
| 3 or fewer visits | 1,400 | 98 | 7.0% |
| All recent users | 2,400 | 288 | 12.0% |
Frequency still separates buyers within the recent group (19.0% against 7.0%), so combining the two earns its complexity. If both halves had been near 12%, the second variable would only add a rule to maintain. A good test for any second variable: does the rate differ clearly inside each band of the first?
How do you choose which variable to use?
Score each candidate on four questions before building it:
- Does it separate outcomes? Use the best-to-worst ratio as in the example; below about 2, it rarely changes a decision.
- Is each band big enough? Fewer than about 100 people makes the rate too noisy to act on.
- Can you act on it differently? A segment that gets the same message as everyone else is a report, not a segment.
- Can you keep it fresh? A variable computed from last year's data gives stale groups.
For a store with a tidy purchase history start with recency and frequency. For a product with feature events, usage depth is often the strongest because it is closest to the outcome. For a content site without logins, interest and journey stage are what you have, and they cannot be tied to named people.
How many segments are too many?
Start with three to five that each have a different action attached. Define them with a rule that fits in one sentence, name them by the action ("lapsing buyers", not "Segment 7") and review them on a schedule. In the example, a useful first set might be: lapsing buyers (variable 1), heavy users without a purchase (variable 4), newsletter responders (variable 8), and new users who have not signed up (variable 7). Four rules, four messages. If two segments would get the same message, merge them.
How do you build these segments in TapCub?
Take the example above and the segment "active in last 7 days with 4 or more visits". In TapCub:
- Make sure people are identifiable. Behavioral segments are built on people, so call
tapcub.loginwhen someone logs in; anonymous visitors have no profile and do not enter segments. - Define the rule. In All-platform analytics › Users › Segments & tags, create a rule segment from conditions such as did or did not do an event, a property, first seen, active, in another segment, a sequence, a tag, a random bucket or a preference. Rule segments refresh daily or on demand; realtime segments add people as events arrive; static segments take pasted IDs.
- Use the RFM view for variables 1 to 3. The same page has an RFM view that places people in 10 groups (such as Champions, Loyal, At risk, Can't lose them, Hibernating) and records movement between groups.
- Check journey stage. In All-platform analytics › Behavior › Behavior analysis, the lifecycle view gives New, Returning, Resurrecting and Dormant counts by week or month.
- Reuse the segment. A saved segment can be used as a group in funnels and retention, so you can see whether heavy users convert differently, and the segment keeps a 30-day size trend.
TapCub does not send the campaign and has no email tool; it defines the group and measures what the group does afterwards. It does not score leads.
FAQ
What are the variables of behavioral segmentation?
Common ones are recency, frequency, monetary value, usage rate or depth, benefits sought, purchase occasion, journey stage and response to campaigns. Textbooks usually name benefit, occasion and usage; analytics data adds the RFM measures and journey stage.
What is an example of behavioral segmentation?
Splitting 12,000 users by how recently they were active: 2,400 active in the last 7 days purchased at 12.0%, while 6,000 inactive for more than 30 days purchased at 1.6%. Each group gets a different message, a prompt for the active users and a win-back for the lapsed ones.
How is behavioral segmentation different from demographic segmentation?
Demographic segmentation groups people by who they are (age, location, job), while behavioral groups them by what they did. Behavior changes, so a person can move between behavioral segments, and it usually predicts the next action more directly.
How many behavioral variables should I use?
Start with one or two that separate outcomes and that you can act on, such as recency plus frequency. Add a third only if it still separates buyers inside each band of the first two.
Can I segment anonymous visitors by behavior?
Only in aggregate. In TapCub an anonymous visitor has no profile, so they do not enter segments. Identify people with a login call to build person-level behavioral segments.
Sources
- OpenStax. Principles of Marketing, 5.1 Market Segmentation and Consumer Markets — benefit, occasion and usage-based segmentation; the 80/20 statement. Verified 2026-11-20.
- Peter S. Fader, Bruce G. S. Hardie and Ka Lok Lee. RFM and CLV: Using Iso-Value Curves for Customer Base Analysis. Journal of Marketing Research 42(4), 2005 — recency, frequency and monetary value tied to customer lifetime value.
Was this article helpful?
We use your answers to fix and expand this page.
Couldn’t send. Please try again in a minute.
Thanks for the feedback. We’ll use it to improve this page.You’ve already sent feedback on this page. Thanks.

Customer Experience Consultant
Writes about live chat, visitor conversations, and self-service, sharing practical ways to make customer communication clearer and more effective.