Try it on your own data
Every report in this article is in the free plan. One snippet for web and apps, up to 10 sites.
Start freeBounce rate analysis means splitting one site-wide bounce rate into slices (source, device, landing page) and ranking the slices by the excess bounces they add compared with the rest of the site, so you fix the one or two that matter instead of the average. In a sample of 8,000 sessions at 50.25%, two source-and-device cells held all the excess, and one landing page held most of it.
What you will learn
- Slice by source, device and landing page, then cross the cuts; an average hides a mix, and Simpson's paradox can reverse a trend
- Rank slices by actual minus expected bounces rather than by rate, and compare each slice with the rest of the site
- Check an interval before acting on a slice: 70% on 1,500 sessions is solid, 70% on 30 sessions is not
What does bounce rate analysis actually involve?
Bounce rate analysis is the habit of splitting one site-wide bounce rate into slices (source, device, landing page) until the slice that produces most of the excess bounces stands out. The site-wide figure only tells you that something is off; the slices tell you where.
First pin down what is being counted, because tools differ. Google's GA4 help defines an engaged session as one that lasts longer than 10 seconds, records a key event, or has at least two page or screen views, and defines bounce rate as "the percentage of sessions that were not engaged". TapCub counts a bounce as a session with exactly one pageview and no custom event, and divides bounced sessions by sessions. A reader who spends four minutes on one article is a bounce under the second rule and not under the first, so write down which definition your report uses before comparing numbers across tools. The related question of what a bounce is not (an exit) is covered in bounce rate vs exit rate, and fixes are in how to reduce bounce rate; this guide is about finding the cause first.
Why is the site-wide bounce rate not enough?
An average hides the mix. A site-wide 50% could be every page at 50%, or one page at 80% dragging the rest. The two situations need opposite responses: in the first you rewrite the whole experience, in the second you fix one page.
Averages can also point the wrong way. Simpson's paradox, described in the classic Berkeley admissions study (Bickel, Hammel and O'Connell, Science, 1975), is the case where a trend that appears in the combined data reverses or disappears inside the subgroups, because the subgroups differ in size and mix. Bounce data hits this constantly: mobile looks worse than desktop overall partly because mobile gets more of the traffic from channels that bounce more, not because phones are broken.
So the method has three rules: slice before you conclude, rank slices by the bounces they add (not by their rate), and check that a slice is big enough to trust.
Worked example: slicing 8,000 sessions
Sample data: one month on a marketing site, 8,000 sessions, 4,020 of them bounced, which is 4,020 ÷ 8,000 = 50.25%.
Step 1, by source. The first cut is traffic source.
| Source | Sessions | Bounced | Bounce rate |
|---|---|---|---|
| Organic | 4,200 | 1,860 | 44.3% |
| Paid | 2,400 | 1,500 | 62.5% |
| 800 | 270 | 33.8% | |
| Social | 600 | 390 | 65.0% |
Step 2, by device. Mobile has 4,200 sessions and 2,460 bounces (58.6%); desktop has 3,800 sessions and 1,560 bounces (41.1%). A 17.5-point gap looks like a mobile problem.
Step 3, source × device. Cross the two cuts before believing it:
| Source | Device | Sessions | Bounced | Rate | Expected at 50.25% | Excess bounces |
|---|---|---|---|---|---|---|
| Organic | Desktop | 2,400 | 960 | 40.0% | 1,206 | −246 |
| Organic | Mobile | 1,800 | 900 | 50.0% | 904.5 | −4.5 |
| Paid | Desktop | 900 | 450 | 50.0% | 452.2 | −2.2 |
| Paid | Mobile | 1,500 | 1,050 | 70.0% | 753.7 | +296.3 |
| Desktop | 500 | 150 | 30.0% | 251.2 | −101.2 | |
| Mobile | 300 | 120 | 40.0% | 150.8 | −30.7 | |
| Social | Mobile | 600 | 390 | 65.0% | 301.5 | +88.5 |
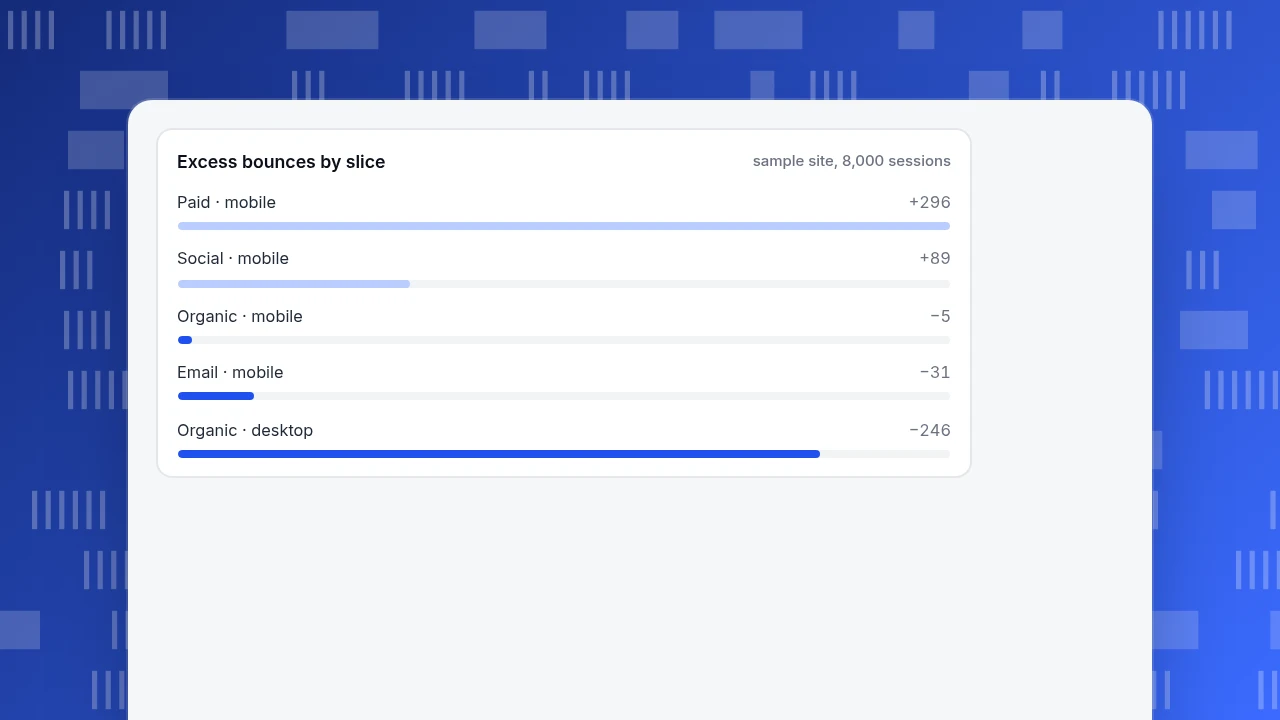
"Expected" is sessions × the site-wide rate, and "excess" is bounced minus expected. Two slices carry all the excess: paid mobile (+296) and social mobile (+89). Organic mobile is at 50.0%, essentially the site average, so phones are not the problem; one paid campaign landing on phones is.
Step 4, by landing page inside the bad slice. Paid mobile's 1,500 sessions arrive on two pages:
| Landing page | Sessions | Bounced | Rate | 95% interval |
|---|---|---|---|---|
| /offer | 1,000 | 800 | 80.0% | 77.4% to 82.4% |
| /pricing | 500 | 250 | 50.0% | 45.6% to 54.4% |
The 800 + 250 = 1,050 bounces reconcile with step 3. The /offer page alone is 800 − (1,000 × 40%) = 400 bounces above what the site's organic-desktop baseline would give. If a fix brings /offer to 55%, bounces fall by 800 − 550 = 250 and the site-wide rate goes to (4,020 − 250) ÷ 8,000 = 47.1%, with no change anywhere else.
Excess bounces by slice
sample site, 8,000 sessionsHow do you decide which slice to look at first?
Rank by excess bounces, not by rate. A 65% rate on 40 sessions is about 6 excess bounces; a 55% rate on 5,000 sessions is about 240.
Use this rule of thumb:
- Compute expected bounces for each slice (sessions × the rate of the whole, or of the rest of the site).
- Subtract from actual bounces.
- Sort descending and work on the top one or two slices; the tail is usually noise.
In the sample, the rest of the site outside paid mobile bounces at 2,970 ÷ 6,500 = 45.7%, against 70.0% for paid mobile. Comparing a slice with "everything else" is a cleaner test than comparing it with a total that contains it.
How many sessions does a slice need?
Enough that the rate stops moving when you re-cut the data. A 95% Wilson interval for a proportion is a quick check. For paid mobile (1,050 of 1,500) it runs from 67.6% to 72.3%, comfortably above the 50.25% site rate. For the same 70% rate on 30 sessions the interval would span roughly 52% to 83%, which would not support a decision.
Practical guidance:
- Under about 100 sessions, treat a rate as a hint to check next period, not a finding.
- Compare two slices only if their intervals do not overlap, or if the gap is large relative to both.
- Look at a full cycle (at least a week, ideally two) so weekday and weekend traffic are both in.
What do you do after finding the slice?
The slice tells you where; you still need why. Match the symptom to a check:
| Symptom | Likely cause | What to check |
|---|---|---|
| One landing page high, others fine | Message mismatch between ad or link and page | Compare the campaign text with the page headline; look at where people click |
| One device high on one source | Layout or speed problem on that device | Load the page on a phone; check page performance and errors for that device |
| One source high everywhere | Low-intent traffic or a mislabelled campaign | Check UTM tagging and the keyword or placement list |
| Everything rose on one date | Release, tracking change or outage | Look for a tagging change or error spike that day |
| High bounce with long time on page | Reader got the answer on one page | Pair with duration; this may be a good bounce |
The last row matters. Bounce is a poor judge of content pages that answer a question completely, so analyse those by time on page and by whether a goal was reached.
| Symptom | Likely cause | What to check |
|---|---|---|
| One landing page high, others fine | Message mismatch between ad or link and page | Compare campaign text with the headline; look at where people click |
| One device high on one source | Layout or speed problem on that device | Test on a phone; check page performance and errors for that device |
| One source high everywhere | Low-intent traffic or mislabelled campaign | Check UTM tagging and keyword or placement list |
| Everything rose on one date | Release, tracking change or outage | Look for a tagging change or error spike that day |
| High bounce with long time on page | Reader got the answer on one page | Pair with duration; may be a good bounce |
Content pages that answer a question fully are better judged by time on page and goal completion than by bounce.
How do you run this analysis in TapCub?
Take the sample above, where paid mobile is the problem. In TapCub the same walk looks like this:
- Start at the source. In Web analytics › Sources, the Channels and UTM tabs show visitors, sessions, pageviews, bounce and duration per row. Click the Paid row to add it as a filter.
- Add the device. With the filter on, open Web analytics › Audience and read the device type row: bounce is shown per device, and clicking a device adds it as a second filter. This is the source × device cell from step 3.
- Find the page. Open Web analytics › Pages: the entry pages tab lists entering sessions per landing path, and the visited pages tab has a bounce rate column. Read the two together, because a page's bounce rate also includes sessions that reached it later. In the sample, /offer would stand out at 80%.
- Look at what people do on it. From a visited or entry row you can open the click map for that path in All-platform analytics › Behavior › Heatmaps; if you have turned on session replay (off by default), it shows individual visits.
- Watch it after the fix. Put a date annotation on the release in Configuration › Annotations and compare the same filtered view for two weeks before and after.
TapCub reports a bounce as one pageview and no custom event, so if your pages fire a custom event on scroll or video play, those sessions stop counting as bounces. Keep that in mind when comparing with other tools. TapCub does not fix the page for you; it shows which slice to fix.
What are the most common mistakes in bounce rate analysis?
- Judging by rate alone. Small slices with extreme rates dominate rankings; use excess bounces and an interval.
- Comparing a segment with a total that includes it. Compare with the rest.
- Mixing definitions. One source's engaged-session bounce is not another's single-pageview bounce.
- Ignoring page speed. Slow pages bounce on phones, and Core Web Vitals are assessed at the 75th percentile against 2.5 s for LCP, 200 ms for INP and 0.1 for CLS (web.dev), so check them on the problem slice.
- Reading a content page's bounce as failure. Pair it with time on page, as Nielsen Norman Group's analysis of 205,873 pages finds that users commonly leave within 10 to 20 seconds, so the first seconds decide whether anyone reads on.
- Cutting once. Stop only when the next cut no longer explains more of the excess.
FAQ
What is bounce rate analysis?
It is splitting a site-wide bounce rate into slices such as source, device and landing page, then ranking the slices by the excess bounces they add compared with the rest of the site. The goal is to find the one or two slices that explain most of the problem before changing anything.
How do you analyze bounce rate?
Cut by source, then device, then cross the two, then open the landing pages inside the worst cell. Rank cells by actual bounces minus expected bounces, check an interval for any small slice, and compare against the rest of the site. In the sample here, two cells produced all the excess.
Which segments should I analyze first?
Start with traffic source, device and landing page, because they are the cuts that most often change the answer and are the ones a team can act on. Add new versus returning visitors, country or campaign only if those three leave excess unexplained.
Is a high bounce rate always bad?
No. A page that answers the question in one visit, such as a contact page or a short article, can bounce at a high rate and still do its job. Judge it with time on page and whether a goal was reached. High bounce on a page meant to lead to another page is the case to fix.
How long should I collect data before drawing conclusions?
At least one full week so weekdays and weekends are both included, and enough sessions per slice that the interval is narrow; about 100 sessions is a floor, and more is better. Re-cut after any release or tagging change.
Sources
- Google Analytics Help. Engagement rate and bounce rate — engaged session criteria and bounce rate defined as the share of sessions not engaged. Verified 2026-11-20.
- Nielsen Norman Group. How Long Do Users Stay on Web Pages? — 205,873 pages analysed; the first 10 seconds decide. Verified 2026-11-20.
- web.dev. Web Vitals — 75th-percentile assessment; LCP 2.5 s, INP 200 ms, CLS 0.1. Verified 2026-11-20.
- P. J. Bickel, E. A. Hammel and J. W. O'Connell. Sex Bias in Graduate Admissions: Data from Berkeley. Science 187, 1975 — an aggregate pattern that does not hold within subgroups.
Was this article helpful?
We use your answers to fix and expand this page.
Couldn’t send. Please try again in a minute.
Thanks for the feedback. We’ll use it to improve this page.You’ve already sent feedback on this page. Thanks.

Customer Experience Consultant
Writes about live chat, visitor conversations, and self-service, sharing practical ways to make customer communication clearer and more effective.