Try it on your own data
Every report in this article is in the free plan. One snippet for web and apps, up to 10 sites.
Start freeA custom attribution model is a credit rule you write yourself: which touchpoints can earn credit and what share each gets. In the worked example, paid social is worth $0 under last touch and $198.70 under a custom 35 / 40 / 25 rule, so the model decides the budget. A custom model is more explicit than a standard one, not more accurate.
What you will learn
- Set weights by role (first, middle, last), make them total 100% at every path length and write a reason for each
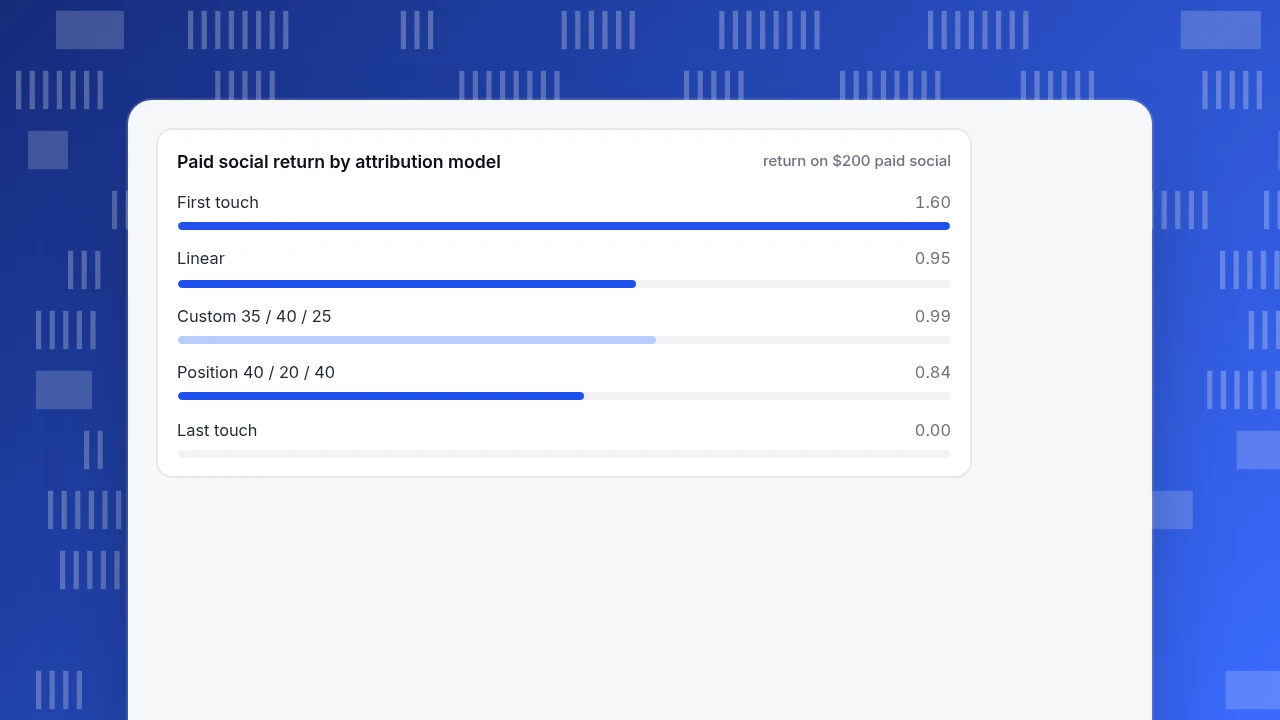
- In the sample, paid social returns 0.00 on $200 under last touch, 0.95 under linear and 0.99 under the custom rule
- Validate with sensitivity, a second month and an experiment before moving budget; TapCub compares five models but does not take custom weights
What a custom attribution model is
A custom attribution model is a credit rule you write yourself: which touchpoints can earn credit for a conversion, and what share each one gets. Standard models fix those rules for you (all credit to the last touch, equal shares, 40% to the first and last). A custom model starts from one of them and changes the weights because your sales journey does not behave the way the standard rule assumes.
Two clarifications before the arithmetic. A custom model is not more accurate than a standard one; it is more explicit. It encodes your belief about which touches matter, and the weights are only as good as the evidence behind them. And an attribution model divides credit among sessions that happened; it does not prove a touch caused anything. For the models themselves see attribution models and multi-touch attribution.
Standard models first: five paths, one set of revenue
Sample data: five conversions in a month, $600 in total, across three channels: paid social (PS), organic search (OS) and email (EM). Each path lists touches in order.
| Path | Touches | Revenue |
|---|---|---|
| 1 | PS → OS → EM | $120 |
| 2 | OS → EM | $80 |
| 3 | PS → EM | $100 |
| 4 | OS → PS → OS → EM | $200 |
| 5 | PS → OS | $100 |
Now apply standard rules. Position-based here follows TapCub's rule: one touch gets everything, two touches split in half, and with three or more the first and last get 40% each and the middle touches share 20%.
| Model | Paid social | Organic search | Total | |
|---|---|---|---|---|
| Last touch | $0 | $100 | $500 | $600 |
| First touch | $320 | $280 | $0 | $600 |
| Linear | $190 | $230 | $180 | $600 |
| Position-based (40 / 20 / 40) | $168 | $214 | $218 | $600 |
Look at paid social: it ranges from $0 to $320 depending on the rule. Spend on paid social in the month was $200 (sample), so return on ad spend runs from 0.00 under last touch to 1.60 under first touch. The model alone decides whether the channel looks like waste or a winner. That is the situation in which people reach for a custom model.
| Model | Paid social | Organic search | |
|---|---|---|---|
| Last touch | $0 | $100 | $500 |
| First touch | $320 | $280 | $0 |
| Linear | $190 | $230 | $180 |
| Position (40 / 20 / 40) | $168 | $214 | $218 |
| Custom (35 / 40 / 25) | $198.7 | $246.3 | $155.0 |
Sample data: five conversions, $600 in total. Custom weights: first 35%, last 25%, middle share 40%, normalised for two-touch paths.
Build the custom weights
Write the rule in four steps, in a spreadsheet, before you open any tool.
- Choose a baseline. Pick the standard model closest to how you believe your customers behave. Here, a considered purchase where discovery and the final nudge both matter, so a position-style model.
- Set weights by role, not by channel name. Roles survive when channels change. Sample choice: first touch 35%, last touch 25%, middle touches share 40%. The reasoning: the first touch created awareness, the middle touches built consideration, and the last touch (often an email reminder) closes a sale that was largely decided.
- Make the weights add to 100%. Define what happens at every path length. With one touch it gets 100%. With two touches there is no middle, so normalise 35 : 25 to 58.3% and 41.7%. With three touches: 35 / 40 / 25. With four: 35 / 20 / 20 / 25.
- Write down why. One sentence per weight, with the evidence. A weight written as "last touch 25%, because a holdout test showed the reminder email recovers about a quarter of the sales it touches" (a hypothetical example) is one you can defend and revisit. "25% because it felt right" is not.
Apply it to path 4 (OS → PS → OS → EM, $200): OS gets $70 (35%) as first touch, PS gets $40 (20%) as a middle touch, the second OS touch gets $40 (20%), and EM gets $50 (25%). Organic search then holds $110 of that path in total, because it appears twice.
Compare custom with linear and last touch
Run the custom rule on all five paths and put it beside the standard models:
| Model | Paid social | Organic search | PS return on $200 spend | |
|---|---|---|---|---|
| Last touch | $0.0 | $100.0 | $500.0 | 0.00 |
| First touch | $320.0 | $280.0 | $0.0 | 1.60 |
| Linear | $190.0 | $230.0 | $180.0 | 0.95 |
| Position-based (40 / 20 / 40) | $168.0 | $214.0 | $218.0 | 0.84 |
| Custom (35 / 40 / 25) | $198.7 | $246.3 | $155.0 | 0.99 |
Custom lands near linear for paid social ($198.7 against $190.0) and gives email $25 less than linear ($155.0 against $180.0). If your custom model and linear agree, stop: the extra complexity bought you nothing. If they disagree on a channel, that is where the decision lives, and it tells you which assumption to test. Here the disagreement is small, and the real gap is between last touch (paid social worth nothing) and everything else.
One further comparison is useful: a decay rule. A time-decay model with a 7-day half-life gives a touch weight 0.5^(age in days ÷ 7). For path 4 the touches are 25, 14, 3 and 0 days old, so the raw weights are 0.084, 0.250, 0.743 and 1.000, which total 2.077. Shares: 4.0%, 12.0%, 35.8% and 48.1%. The touch ages on the other paths (sample data) are 12, 5 and 0 days for path 1, 6 and 0 for path 2, 20 and 1 for path 3, and 9 and 0 for path 5. Across the five paths it gives paid social $85.5, organic $217.2 and email $297.3. Decay rewards recency; your custom rule rewards roles. Neither is a measurement of cause.
Paid social return by attribution model
return on $200 paid socialWhen a custom model is worth building
Build one when all three are true: the standard models disagree on a channel you are deciding about, you have a stated reason for different weights, and you can test the decision later. Do not build one when:
- The ranking does not change. If every model puts the same channel first, the choice of model is not your problem.
- You have fewer than a few hundred conversions a month. Weights fitted to a handful of paths are noise with a formula on top.
- The question is about causation. Credit rules cannot tell you what would have happened without a touch. A holdout or geo test can.
- You cannot explain the weights to someone sceptical. If you cannot defend them in a sentence each, the model becomes a way to defend a budget that was already chosen.
Validate the weights before you move budget
A custom model is a hypothesis. Three checks turn it into something you can act on:
- Sensitivity. Move each weight by ±10 points and see if the channel order changes. If a small change flips your decision, you do not have a decision yet.
- Stability. Compute the model on two different months. If paid social is worth $198.7 one month and $60 the next with similar spend, the data is too thin.
- Experiment. Cut a channel in a region or for a random share of audience and measure the real loss in conversions. If the custom model said the channel was worth 30% of revenue and switching it off lost 5%, the model is wrong.
Move budget in steps, not all at once: 10 to 20% of a channel's spend per cycle, re-reading the result each time.
What the platforms allow
Check what your tools still support before designing weights. Google Analytics 4 now offers data-driven attribution, paid and organic last click, and Google paid channels last click; its help page says first click, linear, time decay and position-based were no longer available as of November 2023. Google Ads likewise says first click, linear, time decay and position-based are no longer supported and that those conversion actions were upgraded to data-driven attribution. Campaign Manager 360's help page describes the older custom model design: choose a baseline (linear, time decay, position-based, first or last interaction), set a half-life for time decay or percentages that total 100% for position-based, and apply credit multiples where overlapping rules multiply (0.2 and 3 on the same touchpoint give 0.6). The page also says custom models created in that tool are no longer supported for reporting. In practice, a custom model today usually lives in your own spreadsheet, warehouse or analytics tool, not in an ad platform.
Testing weights in TapCub
Take the five paths above. The question is whether paid social, which last touch values at $0, deserves the $200.
- Open the report. Go to All-platform analytics › Behavior › Behavior analysis and choose attribution. The measurement is a goal (one event or page, written like a funnel step) and it is required.
- Pick the touch. The touch defaults to channel, falling back to the referrer channel when empty. You can also choose referrer channel, UTM source, UTM campaign, referrer domain or landing page.
- Set the window. The lookback window defaults to 30 days (1 to 90) and includes the session of the conversion itself.
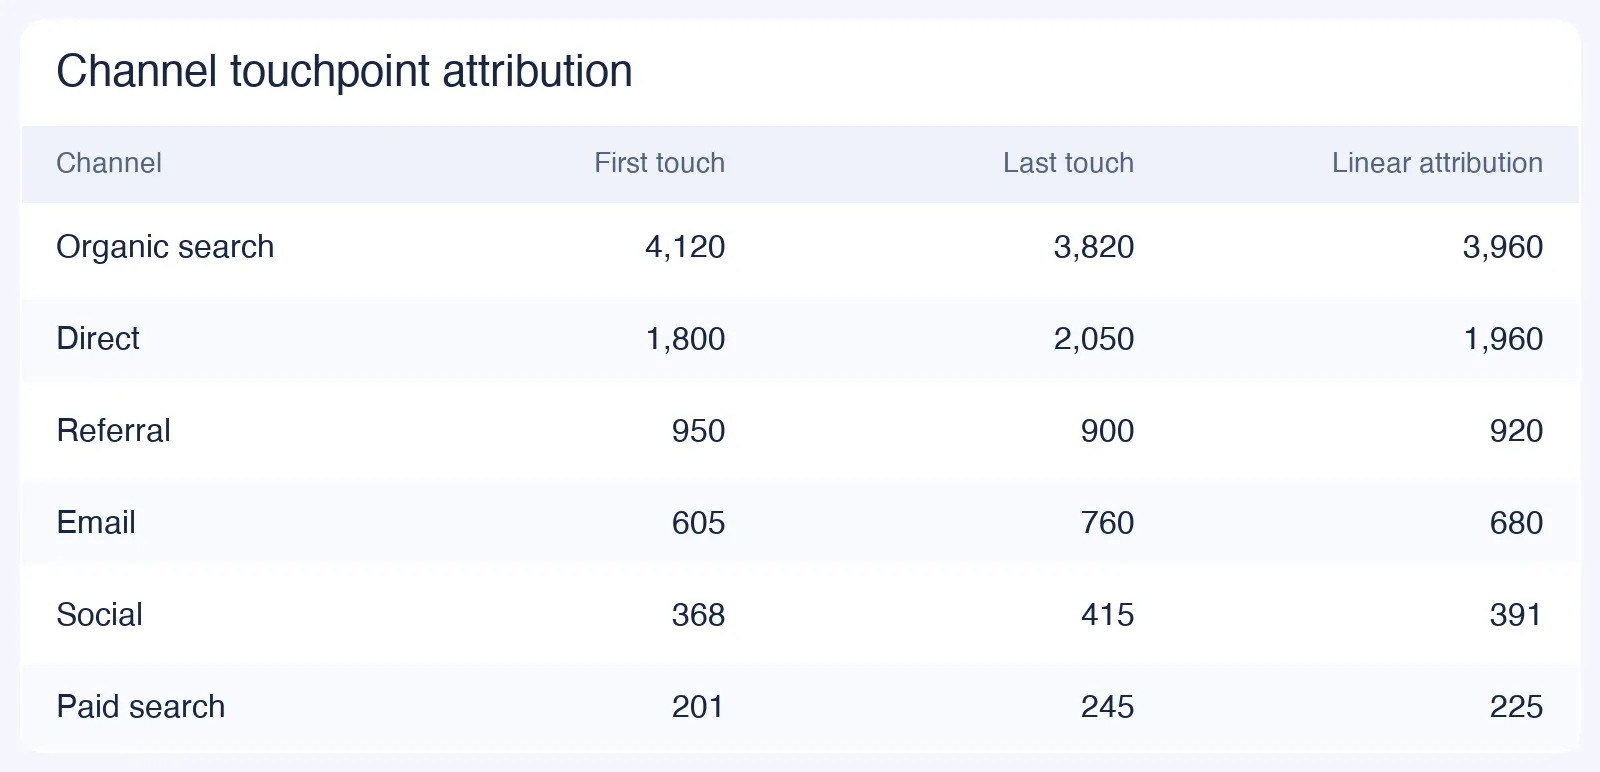
- Select several models at once. Choose first touch, last touch, linear, position and time decay (half-life default 7 days, 1 to 90). Each becomes a column of credited conversions, so a channel that earns credit under linear and none under last touch, an assist-only channel, is visible at a glance.
- Read the touch table. Each row shows credited conversions per model, paths (conversions that included the touch), touch sessions and the touch rate (paths ÷ touch sessions).
- Know the limit. TapCub does not offer custom weights; its position rule is fixed at 40 / 20 / 40 and the time-decay half-life is the one number you can tune. To apply your own weights, query event data in All-platform analytics › Behavior › Metrics & SQL, or export raw detail from All-platform analytics › Data › Data export, and compute the shares as in the table above. The report also scores at most 50,000 conversions and keeps 200 rows. It uses sessions before the conversion, not an install postback.
- Mark changes. Use Configuration › Annotations to mark the date a budget moved so the next report shows before and after.
FAQ
What is a custom attribution model?
It is a credit rule you define: which touchpoints can earn credit and what share each gets, starting from a baseline such as linear or position-based. It encodes your belief about the journey, so it is not more accurate than a standard model.
How do I create a custom attribution model?
Pick a baseline, set weights by role (first, middle, last), make them add to 100% at every path length, and write a reason for each. Then compare it with linear and last touch, test sensitivity, and validate with an experiment.
When should I use a custom model instead of linear?
When linear and last touch disagree on a channel you are about to fund or cut, you have a reason for different weights and enough conversions to test them. If the custom and linear results agree, keep linear.
Does Google Analytics 4 support custom attribution models?
Its help page lists three models (data-driven, paid and organic last click, Google paid channels last click) and says first click, linear, time decay and position-based were retired as of November 2023. Custom models are built in your own tool.
Can TapCub use custom weights?
No. TapCub compares first, last, linear, position and time decay side by side and lets you tune the time-decay half-life. For your own weights, compute from queried or exported event data.
Sources
- Google Analytics Help: attribution models in GA4, checked 2026-11-20
- Google Ads Help: about attribution models, checked 2026-11-20
- Campaign Manager 360 Help: attribution modeling and custom models, checked 2026-11-20
Was this article helpful?
We use your answers to fix and expand this page.
Couldn’t send. Please try again in a minute.
Thanks for the feedback. We’ll use it to improve this page.You’ve already sent feedback on this page. Thanks.

Product Experience Specialist
Writes about product experience, practical workflows, and growth, turning complex processes into clear steps for everyday decisions.