Try it on your own data
Every report in this article is in the free plan. One snippet for web and apps, up to 10 sites.
Start freeCTR benchmarks differ by channel: about 27.6% for the top organic result, 6.64% for paid search, 2.62% email click rate and 1.93% for Facebook traffic ads. A benchmark only helps if it is dated, counted the same way as your number, and checked against the noise in your own data.
What you will learn
- Compare like with like: organic by position, email by industry row, social by campaign objective
- Benchmarks in this article come from dated public sources; display has no figure we could verify, so use your own history
- Test the gap: in the sample, paid social at 1.81% vs 1.93% is within noise, paid search at 6.00% vs 6.64% is a real 134-click gap
What counts as CTR before you compare anything
Click-through rate = clicks ÷ impressions. The formula is the same everywhere. The denominator is not. A benchmark is only useful if your number is counted the same way as the number you compare it with.
| Channel | What "impression" means | Where you read your own number |
|---|---|---|
| Organic search | A result shown for a query, at any position | Google Search Console or Bing Webmaster Tools |
| Paid search | An ad shown for a query | The ad platform |
| Usually a delivered message, sometimes an opened one | The email platform | |
| Paid social | An ad shown in a feed (and "link clicks" or "all clicks" in the numerator) | The ad platform |
Two traps follow. First, email "click rate" is sometimes clicks per delivered email and sometimes clicks per opened email (click-to-open rate); the second is always much larger. Second, social platforms report "all clicks" (likes, expands, profile taps) and "link clicks" separately. Use link clicks, or you will compare a trimmed figure with a padded one. For the arithmetic on a single channel, see how to calculate CTR.
The benchmark table, by channel
These are the figures from public sources we could open and read on 2026-11-20. Each one is dated and tied to its definition. Treat them as a range to sanity-check against, not a target.
| Channel | Benchmark CTR | Who published it, and the period |
|---|---|---|
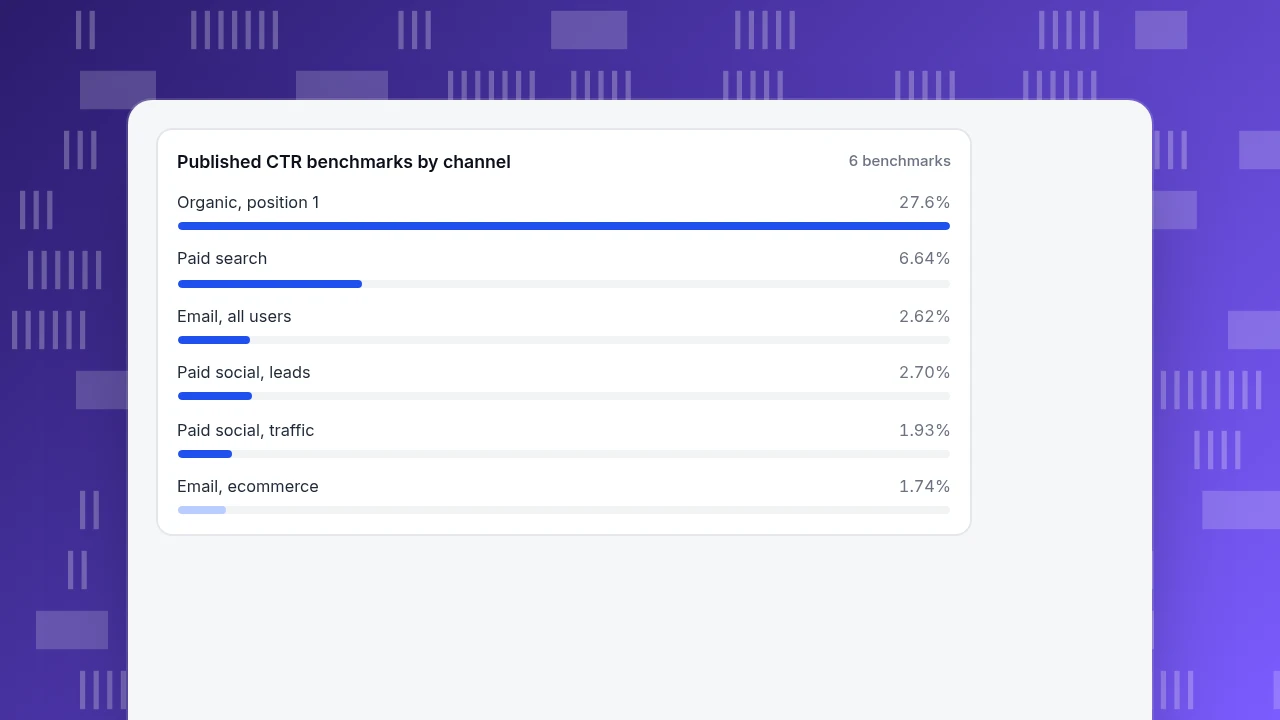
| Organic search, position 1 | 27.6% | Backlinko, analysis of about 4 million Google results; page last updated April 2025 |
| Organic search, positions 1 to 3 combined | 54.4% | Same study |
| Paid search (Google and Microsoft Ads), all industries | 6.64% | WordStream by LocaliQ, April 2025 to March 2026, reported by Search Engine Journal |
| Email, all Mailchimp users | 2.62% click rate | Mailchimp, data last updated December 2023 |
| Email, ecommerce | 1.74% click rate | Mailchimp, same data |
| Paid social, Facebook traffic campaigns | 1.93% | LocaliQ, "Facebook Advertising Benchmarks for 2026", updated 23 September 2026 |
| Paid social, Facebook lead campaigns | 2.70% | Same report |
| Display | No figure we could verify | See the display section below |
The spread inside each channel is as important as the average. In the same paid search report, Arts & Entertainment averaged 12.75% and Automotive repair, service and parts averaged 5.56%, more than a two-fold gap between two industries. A site in the lower industry that matches the overall 6.64% average is doing well, not average.
| Channel | Benchmark CTR | Source and period |
|---|---|---|
| Organic search, position 1 | 27.6% | Backlinko, about 4 million results, page updated April 2025 |
| Paid search, all industries | 6.64% | WordStream by LocaliQ, Apr 2025 to Mar 2026 |
| Email, all users | 2.62% click rate | Mailchimp, data last updated Dec 2023 |
| Email, ecommerce | 1.74% click rate | Mailchimp, same data |
| Paid social, traffic campaigns | 1.93% | LocaliQ Facebook benchmarks 2026 |
| Paid social, lead campaigns | 2.70% | LocaliQ Facebook benchmarks 2026 |
| Display | No verified figure | Use your last 8 to 12 weeks |
Each figure is quoted from the page linked in Sources on 2026-11-20. Definitions differ by platform; check them before comparing.
Organic search: CTR depends on rank, not on the channel
An organic CTR for a whole site is a blend of every query and position, so it says little. The useful benchmark is CTR by position. Backlinko's study of about 4 million Google results puts position 1 at 27.6% and positions 1 to 3 together at 54.4%. It also reports that moving from position 2 to position 1 yields about 74.5% more clicks, the largest relative jump between neighbouring positions, and that position 1 gets roughly ten times the CTR of position 10.
Two caveats change how you use those numbers:
- The page does not state a study date. Its chart files are dated August 2022, so the data is probably from 2022. Use it as a shape of the curve, not a current value.
- AI answers cut the top result's CTR. Advanced Web Ranking, which publishes a monthly CTR study, states that when an AI Overview appears, the reduction at position 1 "has typically been on the order of half", with the size varying by month, device and intent. For queries that trigger an AI answer, a fair expectation at position 1 is nearer 13.8% than 27.6% (27.6 ÷ 2).
The page-by-page view of organic CTR is in organic CTR.
Decision rule: compare a query's CTR with the benchmark only for queries at the same position, and flag the ones where an AI answer sits above the results.
Paid search: compare inside your industry
The WordStream by LocaliQ benchmark of 6.64% covers Google and Microsoft Ads over the 12 months to March 2026. It blends campaign types, so it is a rough guide for a generic search campaign and a poor one for a brand-only or Shopping campaign. Industry figures are the better anchor: 12.75% for Arts & Entertainment and 5.56% for Automotive repair, service and parts were the highest and lowest values cited in the Search Engine Journal summary.
If your account is mostly brand terms, expect your CTR to sit well above the average, and do not read that as success: brand clicks would often arrive anyway. Split brand and non-brand before you compare.
Email: pick the right row and ignore opens
Mailchimp's industry table (data last updated December 2023) lists click rate beside open rate. A few rows: all users 2.62%, business and finance 2.78%, education and training 3.02%, non-profits 3.27%, ecommerce 1.74%. Mailchimp itself warns that Apple's Mail Privacy Protection affects the accuracy of open rates, which is why clicks, not opens, are the number to benchmark.
Use the row that matches your business. A store with a 2.2% click rate is above the ecommerce row (1.74%) and below the all-users row (2.62%). Which comparison is fair? The ecommerce one. Check Mailchimp's own definition of "click rate" on the benchmark page before comparing it with a click-to-open figure.
Paid social: separate the campaign objective
LocaliQ's 2026 Facebook report separates objectives: traffic campaigns average 1.93% and lead campaigns 2.70% across all industries. Within traffic campaigns, Beauty & Personal Care sits at 2.73% and Finance & Insurance at 1.46%. Within lead campaigns the spread is wider: Physicians & Surgeons 4.18%, Beauty & Personal Care 1.35%.
A lead ad has the form inside the platform, so a click is a lighter commitment than a click to your site. Compare a traffic campaign only with the traffic row. A single "social CTR" mixes objectives and tells you nothing.
Display and other channels: when there is no good benchmark
We looked for a current display CTR from a primary source and did not find one we could open and verify. The older figures that circulate (WordStream's 2016 post gives display below 1%) are too old to use, and aggregator pages disagree. Rather than print a number we cannot source, use your own history: the best benchmark for display, native placements or SMS is your last 8 to 12 weeks of the same placement and format.
Is your CTR really below the benchmark?
Take a four-channel month (sample data) and test each against its benchmark with a 95% Wilson interval, which tells you the range your true CTR could plausibly be in given the number of impressions.
| Channel | Clicks ÷ impressions | CTR | 95% interval | Benchmark | Verdict |
|---|---|---|---|---|---|
| Organic, query at position 1 | 1,100 ÷ 5,000 | 22.00% | 20.87% to 23.17% | 27.6% | Below: about 280 clicks short of 1,380 |
| Email (ecommerce) | 310 ÷ 14,000 | 2.21% | 1.98% to 2.47% | 1.74% | Above the ecommerce row |
| Paid search | 1,260 ÷ 21,000 | 6.00% | 5.69% to 6.33% | 6.64% | Below: about 134 clicks short of 1,394 |
| Paid social (traffic) | 650 ÷ 36,000 | 1.81% | 1.67% to 1.95% | 1.93% | Not distinguishable |
The last row is the lesson. 1.81% looks below 1.93%, but the interval 1.67% to 1.95% contains 1.93%, so the gap could be noise. Spending a week rewriting social creative on that evidence would be a guess. With only 600 impressions the picture is worse: 12 clicks is 2.00%, but the interval is 1.15% to 3.46%.
Rule of thumb: if the benchmark falls inside your interval, collect more impressions before changing anything. If it falls outside, you have a real gap and can estimate its size in clicks, as in the table.
Published CTR benchmarks by channel
6 benchmarksHow to blend channel CTRs without fooling yourself
A single "overall CTR" is weighted by impressions, not averaged across channels. With the four rows above:
- Total clicks = 1,100 + 310 + 1,260 + 650 = 3,320
- Total impressions = 5,000 + 14,000 + 21,000 + 36,000 = 76,000
- Blended CTR = 3,320 ÷ 76,000 = 4.37%
- Average of the four CTRs = (22.00 + 2.21 + 6.00 + 1.81) ÷ 4 = 8.00%
The unweighted average is almost twice the real figure because a small, high-CTR channel counts as much as a large, low one. Report the weighted number, and keep channels in separate rows when you set targets, because the channels do different jobs.
What a low CTR does and does not tell you
CTR measures the click, not what happens next. Use these rules:
- CTR below benchmark, conversions fine: the people who click are the right ones. Do not chase a higher CTR with broader, more clickable copy.
- CTR above benchmark, conversions low: the promise in the ad or snippet does not match the page. Look at the landing page, not the ad.
- CTR varies by position (organic): a title rewrite helps only for queries already ranking well. A page at position 3 with a low CTR is a better title test than a page at position 15.
- CTR changes after an AI Overview appears: expect position 1 to fall by up to about half without any change on your side, so check the query before blaming the title.
Measuring what follows the click in TapCub
Suppose the paid search row above is 134 clicks short of benchmark. Before touching the ads, you want to know whether those clicks were worth having. TapCub does not see ad impressions, so it cannot calculate paid CTR. TapCub does not run ads either; it measures what happens after the click.
- Open Web analytics › Sources and filter by the campaign UTM to see sessions and goal conversions per source and campaign. Name your UTM parameters consistently, as in how to name UTM parameters.
- Compare conversion rate per campaign with its CTR. A campaign with a 6.0% CTR and a high goal conversion rate does not need more clicks; one with a high CTR and no conversions needs a landing page fix.
- For organic CTR, connect Google Search Console or Bing Webmaster in Monitoring › Search performance. It shows clicks, impressions, CTR and average position by page, query and country, and flags pages ranking in the top 10 with a click-through rate below the median. Search data usually arrives 1 to 3 days late.
- Human and bot traffic are counted separately, so crawler hits do not inflate the sessions and conversions you divide by.
FAQ
What is a good CTR?
It depends on the channel and, for organic, on position. As public reference points: 27.6% at organic position 1, 6.64% for paid search, 2.62% email click rate across Mailchimp users and 1.93% for Facebook traffic campaigns. Compare inside your own industry and against your last 8 to 12 weeks.
Is a 2% CTR good?
For email or paid social, 2% is near the average (2.62% and 1.93%). For paid search it is well below 6.64%, and for an organic result at position 1 it is far below 27.6%. The same number means different things by channel.
Why is my CTR lower than every benchmark?
Check the definition first: clicks per delivered versus per opened email, or link clicks versus all clicks. Then check mix: brand against non-brand, position and objective. Finally check whether your interval contains the benchmark, because a small impression count produces wide intervals.
Do AI Overviews change organic CTR?
Advanced Web Ranking reports that the position 1 reduction has typically been on the order of half when an AI Overview appears. Size varies by month, device and intent, so watch your own queries in Search Console.
Can TapCub calculate my ad CTR?
No. Impressions live in the ad platform. TapCub measures sessions, sources, UTMs and goals after the click, and shows organic CTR from connected search data.
Sources
- Backlinko: Google organic CTR study, about 4 million results, checked 2026-11-20
- Advanced Web Ranking: Google organic CTR study, checked 2026-11-20
- Mailchimp: email marketing benchmarks, data last updated December 2023, checked 2026-11-20
- Search Engine Journal: 2026 Google Ads benchmarks (WordStream by LocaliQ), updated 2026-06-16
- LocaliQ: Facebook advertising benchmarks for 2026, updated 2026-09-23
Was this article helpful?
We use your answers to fix and expand this page.
Couldn’t send. Please try again in a minute.
Thanks for the feedback. We’ll use it to improve this page.You’ve already sent feedback on this page. Thanks.

Product Adoption Consultant
Explores customer onboarding, live conversations, and self-service, turning common usage questions into practical guidance and improvements.