Try it on your own data
Every report in this article is in the free plan. One snippet for web and apps, up to 10 sites.
Start freeOrganic CTR is the share of times your unpaid result was shown and clicked: clicks divided by impressions. There is no standard good value, because it depends on position, query intent and the features on the result page. Judge a page by comparing it with other pages at the same position on your own site, not with an industry average.
What you will learn
- Organic CTR = clicks ÷ impressions; a good value depends on position, intent and result-page features
- Compare each page with the median CTR of pages at the same position on your site: in the sample, 3.0% at position 4 against a 4.0% median is worth 100 clicks a month
- Wait for equal 28-day windows and enough impressions before judging a title change: about 14,000 per window to see 3.0% → 3.6%
What is organic CTR, and how is it calculated?
Organic CTR (organic click-through rate) is clicks on your unpaid search results divided by the number of times those results were shown:
Organic CTR = organic clicks ÷ organic impressions
Google Search Console defines the pieces this way: clicks are the number of times a user clicked through to your site from Google results, impressions are how many times your site appeared in results, and CTR is the click count divided by the impression count. An organic click is therefore a click on a regular result, not on an ad.
Sample data: a page at position 4 is shown 10,000 times in a month and receives 300 clicks. Its organic CTR is 300 ÷ 10,000 = 3.0%. Whether 3.0% is good or poor is what the rest of this article answers. The formula itself is covered in how to calculate CTR; this article is about what to compare it with, and what to change. For the other half of the fraction, see impressions.
Why is there no standard organic CTR?
Because CTR depends on three things that differ by page and by query: position, intent and what else is on the results page. A single "average CTR" mixes them all.
Position. Sistrix analyzed more than 80 million keywords using Google Search Console data from partners (mobile only, published in 2020). It found an average CTR of 28.5% at position 1, 15.7% at position 2, 11% at position 3 and 2.5% at position 10. The curve is steep: the gap between positions 1 and 3 is 17.5 points, and between 3 and 10 it is 8.5.
Result-page features. The same study shows how other elements take clicks from position 1:
| Result page has | Position 1 CTR | Compared with the 28.5% average |
|---|---|---|
| Only organic results | 34.2% | higher |
| A featured snippet | 23.3% | about −5 points |
| Google Ads | 18.8% | about −10 points |
| A Google Shopping box | 13.7% | about −15 points |
Intent. Searches for a brand name behave differently from searches for a solution, because people already know where they want to go. Benchmarks that blend both are hard to use.
Whole-site averages. Ahrefs published medians from anonymized Search Console data covering 422,421 websites: for a whole website, a good organic CTR is typically 1% to 2%, with sub-1% described as the norm for sites under Domain Rating 40. A whole-site figure includes pages at every position, which is why it looks nothing like the position table above.
Take two lessons from this. A page at position 8 with 2.5% CTR is normal, and a page at position 2 with 8% is weak. And a benchmark from another year or site type can mislead by a factor of three. These are population averages, not targets for your page.
| Benchmark | What it measures | How to use it |
|---|---|---|
| SISTRIX position curve (2020, mobile) | Average CTR by position: 28.5% at 1, 15.7% at 2, 11% at 3, 2.5% at 10 | See how steep the curve is; not a target for your page |
| Ahrefs whole-site medians (422,421 sites) | Typical whole-site CTR of 1% to 2% | Sanity check for the whole site only |
| Your same-position median | Median CTR of your own pages in the same position bucket | The comparison to judge a page |
| SparkToro zero-click study (2024) | About 58.5% of US Google searches end without a click | Background for falling CTR with rising impressions |
Each figure has a year and a method; use them as context, not as targets.
How do you tell if your page's CTR is good?
Compare each page with other pages at the same position on your own site. Your site, your audience and your result-page features are baked into those numbers, so the comparison is fair in a way an industry average never is.
The method has three steps:
- Export clicks, impressions and average position by page for a full period (28 days or more).
- Put pages in position buckets: 1, 2–3, 4–6, 7–10.
- Take the median CTR in each bucket and compare each page with its bucket's median.
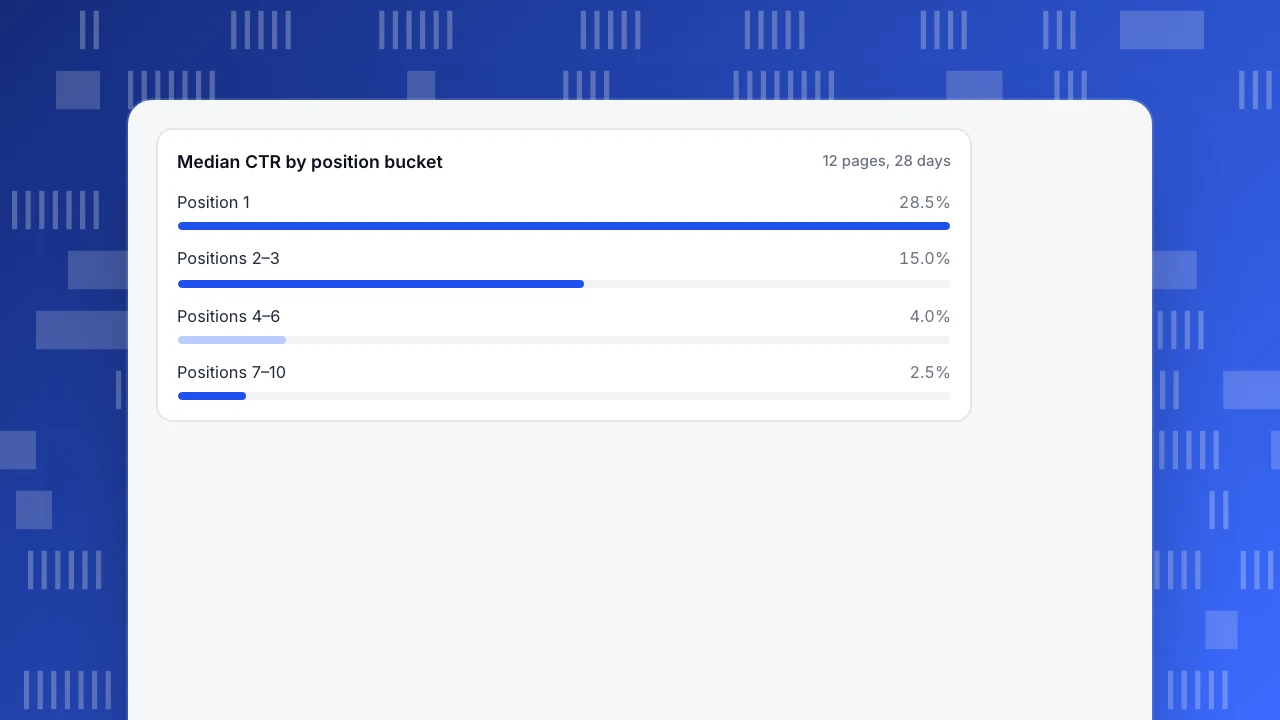
Sample data: 12 pages from one site over 28 days.
| Position bucket | Pages | Median CTR |
|---|---|---|
| 1 | 2 | 28.5% |
| 2–3 | 3 | 15.0% |
| 4–6 | 4 | 4.0% |
| 7–10 | 3 | 2.5% |
The page from the earlier example, at position 4.0 with 3.0% CTR, sits in the 4–6 bucket. The other three pages in the bucket have CTRs of 4.5%, 4.0% and 4.0%, so the median is 4.0%. Gap: 4.0% − 3.0% = 1.0 point. On 10,000 impressions that is 100 clicks per month left on the table. A page at 4.4 with 4.5% is above its bucket and needs no work.
A bucket needs at least three or four pages to have a meaningful median. With few pages, widen the buckets, or compare against the previous period for the same page.
Median CTR by position bucket
12 pages, 28 daysIs a low CTR a title problem or a ranking problem?
Read position and CTR together. This table gives the first decision for each combination:
| What you see | Likely cause | First action |
|---|---|---|
| Position 1–3, CTR far below the bucket median | Something on the page above or around you takes clicks: ads, a snippet, a Shopping box | Look at the live result page; then review the title |
| Position 4–10, CTR below the bucket median | Your title or description is weaker than the neighbors' | Rewrite title and description first |
| Position 11–20, low CTR | Normal: few people reach page two | This is a ranking problem; do not touch the snippet yet |
| Impressions up, average position worse, CTR down | New queries at lower positions entered the mix | Wait; check whether the page moves up |
| Impressions flat, CTR down on many pages at once | A change on the result page, not on your pages | Do not rewrite; watch for a few weeks |
| CTR fine, clicks low | Too few impressions | Work on ranking and coverage, not snippets |
The rows with "do not rewrite" matter as much as the others. Editing 40 titles because CTR fell across the whole site, when the cause was a new feature on the result page, wastes the effort and muddles the data.
How do you improve organic CTR?
Start with the pages where a fix is worth the most. Estimate each page's upside as impressions × (bucket median − current CTR). Sample data:
| Page | Impressions | Current CTR | Bucket median | Extra clicks per month |
|---|---|---|---|---|
| /pricing-guide | 25,000 | 2.5% | 4.0% | 375 |
| /blog/how-to-x | 10,000 | 3.0% | 4.0% | 100 |
| /features | 8,000 | 1.5% | 2.5% | 80 |
Work from the top. Google's documentation gives the rules for what you can change:
- Title. Google says to write descriptive, concise title text and to avoid repeated or boilerplate titles. It also says it may generate a different title from the page's own content when the
<title>is poor, so a vague or stuffed title may not even be the one searchers see. - Description. Google creates snippets mostly from page content, but may use the meta description when it describes the page more accurately. Write a unique description per page that summarizes the page, and add useful details such as price or date where they help someone decide to click.
- Match the query. The most common cause of a weak snippet is a title that answers a different question from the one searchers typed. Look at the top queries for the page and make sure the title speaks to the biggest one.
Change one thing at a time on each page, so that if CTR moves you know why. Do not add clickbait: a title that wins the click and loses the visitor raises CTR and hurts everything after it.
How long should you wait to judge a change?
Long enough for the numbers to be more than noise. Sample data: before the rewrite, 10,000 impressions and 300 clicks (3.0%); after, 10,000 impressions and 360 clicks (3.6%). A two-proportion test gives z ≈ 2.38 (p ≈ 0.018), so the lift is unlikely to be chance. With 330 clicks instead (3.3%), z ≈ 1.21 (p ≈ 0.22): you cannot tell it from luck.
Use these rules:
- Compare equal windows of at least 28 days, so each contains four of every weekday.
- Need enough impressions. To detect a move from 3.0% to 3.6% reliably, you need about 14,000 impressions in each window. Pages with fewer impressions need a bigger change or a longer wait.
- Check position first. If average position changed by more than about half a place, the CTR change may be caused by ranking, not the snippet.
- Do not judge on day three. Search Console marks the newest data as preliminary, and TapCub's search data is usually one to three days late.
How do SERP features and zero-click searches change the picture?
Impressions can grow while clicks stay flat because the result page keeps more of the answer on Google itself. SparkToro and Datos analyzed clickstream data for US searches and estimated that about 58.5% of Google searches in 2024 ended without a click on any result, and that for every 1,000 searches only about 360 clicks went to sites outside Google's own properties and ads. That study covers all searches, not yours, so use it as background, not as a benchmark.
What it means for you: when CTR falls across many pages while impressions rise and your titles have not changed, suspect the result page before your own pages. For the mechanics and what to do about them, see zero-click searches. To raise clicks by being found for more queries, see how to improve organic search.
What mistakes make CTR numbers misleading?
- Using an industry average as a target. It mixes positions, intents and features. Use same-position medians on your own site.
- Averaging CTRs without weighting. Sample data: three pages with 90,000, 5,000 and 5,000 impressions and CTRs of 1.0%, 8.0% and 3.0%. The simple average is (1.0 + 8.0 + 3.0) ÷ 3 = 4.0%. The true CTR is (900 + 400 + 150) clicks ÷ 100,000 impressions = 1.45%. Always add clicks and impressions first, then divide.
- Mixing brand and non-brand queries. People who search your brand usually click you at any position, so brand queries flatter the total. Report non-brand separately.
- Judging after a few days. See the preliminary-data rule above.
- Changing many things at once. A new title, a new description and a redesign in the same week makes any result impossible to read.
- Chasing CTR on page-two pages. The gain is small until the page ranks higher.
How to find your low-CTR pages in TapCub
Take the 12-page example above. In TapCub you can get the same list without a spreadsheet.
- Connect Google Search Console or Bing Webmaster, then open Monitoring › Search performance. It shows clicks, impressions, CTR and average position by page, query and country. Pick a full period of at least 28 days.
- Look at the rank buckets. They group queries by average position and weight by impressions, so you see how much of your visibility sits in positions 1–3, 4–10 and beyond.
- Use the scatter plot: each point is a page, sized by impressions. Pages in the top 10 whose CTR is below the median are marked, and that set is where changing the title and description pays off first. Use the position-bucket comparison above to judge how big each gap is.
- Edit the title and description of the biggest gap, then mark the date in Configuration › Annotations, so the before-and-after windows are clear.
- After 28 days, filter to that page and compare the two equal windows, using the rules above.
Know the limits. TapCub does not rewrite titles or run title experiments: it does not split traffic, so you compare equal before-and-after windows. Search data is usually 1–3 days late. Baidu offers no click and impression data, so Baidu pages cannot be analyzed this way.
FAQ
What is a good CTR for organic search?
It depends on position. In Sistrix's study of mobile results, position 1 averaged 28.5% and position 10 averaged 2.5%. For a whole site, Ahrefs' medians put a good CTR at 1% to 2%. Judge a page against the median for its own position on your site.
What is the average CTR for organic search?
There is no single average: it ranges from about 28.5% at position 1 to about 2.5% at position 10 in Sistrix's data, and from 1% to 2% for whole sites in Ahrefs' data. Features such as snippets, ads and shopping boxes lower it further.
What is an organic click?
An organic click is a click on an unpaid search result, as opposed to an ad. Search Console's Performance report counts a click each time a user clicks through to your site from Google Search results.
How do you improve click-through rates?
Rank the pages by impressions × (same-position median − current CTR), then rewrite the titles and descriptions of the top ones so they answer the main query. Change one thing at a time and compare equal 28-day windows.
Does position or CTR matter more?
Both, in order. Clicks = impressions × CTR, and in Sistrix's data a move from position 3 to position 2 lifts average CTR from 11% to 15.7%, a gain of 4.7 points. Rewrite snippets on pages that already rank in the top 10, and work on rankings for the rest.
See also: Headline Examples: What Works, With a Test That Catches Clickbait.
See also: CTR Benchmarks by Channel: Search vs Email vs Paid Social.
See also: How to Get SERP Features: Which Ones You Can Earn and How to Measure Them.
Sources
- Performance report (Search results) (Search Console Help: definitions of clicks, impressions, CTR, position; preliminary data)
- Why (almost) everything you knew about Google CTR is no longer valid (SISTRIX, 2020: 80 million keywords, mobile)
- What is a good organic CTR? (Ahrefs: medians from Search Console data of 422,421 websites)
- Influencing your title links in search results and Control your snippets in search results (Google Search Central)
- 2024 Zero-Click Search Study (SparkToro with Datos)
Was this article helpful?
We use your answers to fix and expand this page.
Couldn’t send. Please try again in a minute.
Thanks for the feedback. We’ll use it to improve this page.You’ve already sent feedback on this page. Thanks.

Customer Experience Consultant
Writes about live chat, visitor conversations, and self-service, sharing practical ways to make customer communication clearer and more effective.