Try it on your own data
Every report in this article is in the free plan. One snippet for web and apps, up to 10 sites.
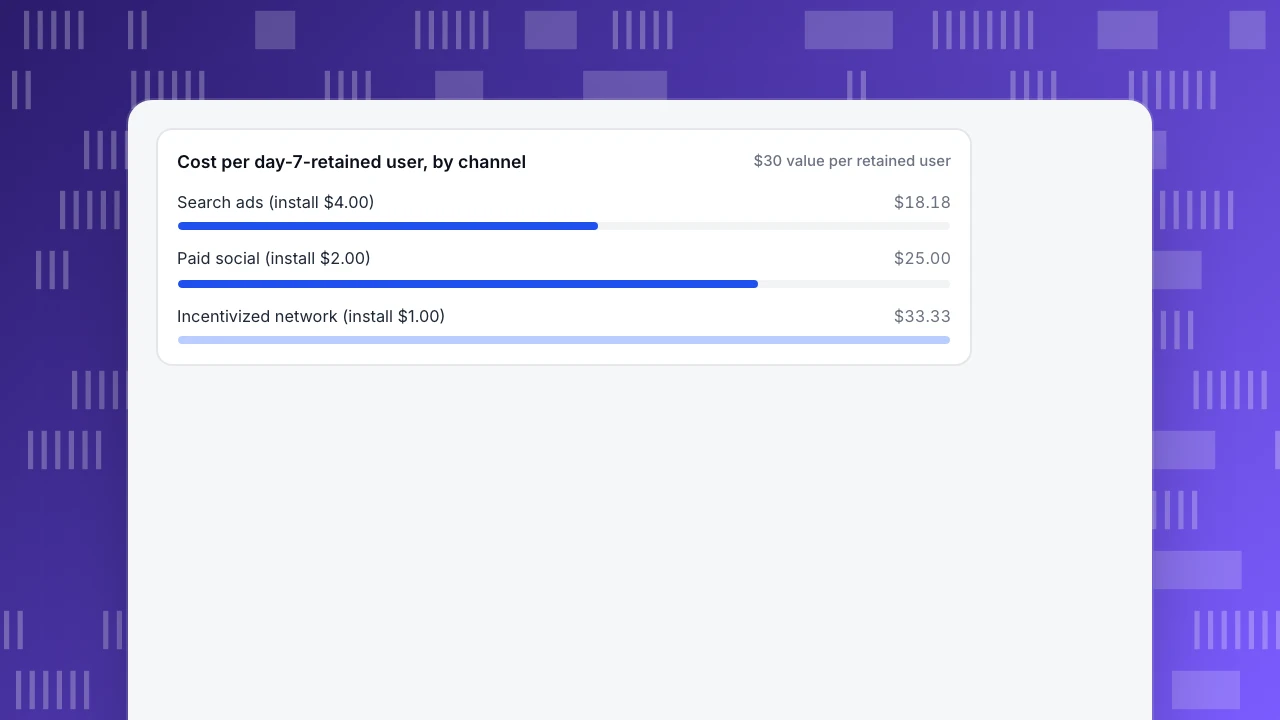
Start freeA mobile user acquisition strategy is the plan for getting people to install your app and keep using it: the channels, what you will pay in each and the checks that the users are worth it. Price channels by cost per retained user, not cost per install. In the sample below the two rankings are exactly reversed, and the cheapest installs lose money.
What you will learn
- Cost per retained user = cost per install ÷ day-7 retention: a $4.00 install at 22% retention ($18.18) beats a $2.00 install at 8% ($25.00)
- Each channel has a ceiling: value of a retained user × its retention; the incentivized network's $0.90 ceiling is below the $1.00 it pays
- Move budget in steps and re-measure: $2,000 shifted from the weakest to the strongest channel buys 50 more retained users if costs hold
What is a mobile user acquisition strategy?
A mobile user acquisition strategy is the plan for getting people to install your app and become real users: which channels you buy or earn them from, what you are willing to pay in each, and how you check that the people who arrive are worth what they cost. It sits inside the wider user acquisition idea, applied to the app store, the install and the first week.
The easy way to run one is to buy installs and watch the cost per install. The better way is to ask what each retained user costs. An install is the cheapest thing a mobile campaign delivers and the least useful: it says a download happened, not that anyone opened the app twice. This article shows how to correct install cost for retention, how to set a price ceiling per channel, and how to keep bad installs out of the numbers.
From impression to payer: the acquisition funnel
Every campaign, in every channel, runs through the same six steps. Each step has one rate, and each rate has an owner who can see it.
| Step | The rate | Who can see it |
|---|---|---|
| Impression → click | Click-through rate = clicks ÷ impressions | Ad platform |
| Click → install | Install rate = installs ÷ clicks | Ad platform, store console or attribution provider |
| Install → activated | Activation rate = users who do the key action ÷ installs | Your own events |
| Activated → still here | Day-1 and day-7 retention = returning users ÷ installs | Your analytics |
| Still here → paying | Payer rate = payers ÷ installs | Purchase events |
| All steps | Cost per install, cost per retained user, cost per payer | Spend plus the rows above |
The first two rows belong to the ad platform, and the next four belong to you. A cost-per-install report stops after row two, which is why it cannot rank channels. For the definition of cost per acquisition in general, see cost per acquisition; for the longer list of metrics, acquisition metrics.
| Step | The rate | Who can see it |
|---|---|---|
| Impression → click | Click-through rate = clicks ÷ impressions | Ad platform |
| Click → install | Install rate = installs ÷ clicks | Ad platform, store console or attribution provider |
| Install → activated | Activation rate = users who do the key action ÷ installs | Your own events |
| Activated → still here | Day-1 and day-7 retention = returning users ÷ installs | Your analytics |
| Still here → paying | Payer rate = payers ÷ installs | Purchase events |
| All steps | Cost per install, per retained user, per payer | Spend plus the rows above |
The first two rows live in the ad platform; the next four live in your own data, which is why install cost alone cannot rank channels.
Why install cost misleads: correct it with retention
Cost per install tells you what a download cost. To tell what a user cost, divide by the share of installs that stay:
Cost per retained user = cost per install ÷ day-7 retention
A $2.00 install with 8% day-7 retention costs $2.00 ÷ 0.08 = $25.00 per retained user. A $4.00 install with 22% day-7 retention costs $4.00 ÷ 0.22 = $18.18. The install that cost twice as much is the cheaper user. Pick the retention day that fits your product: day 1 for a utility opened daily, day 7 for most apps, day 30 for a game with a long arc. The point is to pick one and use it for every channel, and the retention article explains how it is measured: app retention rate.
Worked example: three channels, opposite rankings
Sample data: one month, three paid channels for the same app. A day-7 retained user is assumed to be worth $30 in the following 90 days of revenue (a sample assumption; use your own number).
| Channel | Spend | Installs | Cost per install | Day-7 retention | Retained users | Cost per retained user |
|---|---|---|---|---|---|---|
| Paid social | $9,000 | 4,500 | $2.00 | 8% | 360 | $25.00 |
| Search ads | $6,000 | 1,500 | $4.00 | 22% | 330 | $18.18 |
| Incentivized network | $4,000 | 4,000 | $1.00 | 3% | 120 | $33.33 |
| All three | $19,000 | 10,000 | $1.90 | 8.1% | 810 | $23.46 |
By cost per install the order is incentivized network, paid social, search ads. By cost per retained user it is exactly reversed: search ads, paid social, incentivized network. Now put the $30 value against the spend:
| Channel | Value of retained users | Spend | Net | Return on spend |
|---|---|---|---|---|
| Paid social | 360 × $30 = $10,800 | $9,000 | +$1,800 | +20.0% |
| Search ads | 330 × $30 = $9,900 | $6,000 | +$3,900 | +65.0% |
| Incentivized network | 120 × $30 = $3,600 | $4,000 | −$400 | −10.0% |
| All three | $24,300 | $19,000 | +$5,300 | +27.9% |
The channel with the cheapest installs loses money. The channel with the most expensive installs earns the most. The blended 27.9% hides both facts.
Cost per day-7-retained user, by channel
$30 value per retained userSet a price ceiling per channel, not a target install cost
A channel has a maximum cost per install you can afford, and it depends on its retention:
Maximum affordable cost per install = value of a retained user × day-7 retention
With $30 per retained user: paid social can pay up to $30 × 8% = $2.40 per install (it pays $2.00, a $0.40 margin); search ads can pay $30 × 22% = $6.60 (it pays $4.00); the incentivized network can pay $30 × 3% = $0.90 (it pays $1.00, which is why it loses money).
Three rules follow:
- Rank channels by the margin under the ceiling, not by the install cost: search ads $2.60, paid social $0.40, incentivized network −$0.10.
- Shift money in steps. Moving $2,000 from the incentivized network to search ads buys 110 retained users instead of 60 ($2,000 ÷ $18.18 against $2,000 ÷ $33.33), 50 more, if the cost holds. Costs usually rise as a channel scales, so treat 50 as the ceiling and re-measure after two weeks.
- Re-set the ceiling when retention moves. A channel's ceiling is only as good as the last measured retention, so refresh it each month.
The usual channels, and the number to check for each
| Channel | What it is good for | The risk | Number to check |
|---|---|---|---|
| Paid social | Reach and testing creative at volume | Broad audiences that install and leave | Cost per retained user by campaign |
| Search ads (app campaigns) | People already looking for an app like yours | Higher cost per install, limited volume | Cost per payer and margin under the ceiling |
| Incentivized or reward networks | Cheap installs and fast volume | Users who came for the reward, not the app | Day-7 retention and cost per retained user |
| Creator and influencer posts | Trust and niche audiences | Hard to attribute, uneven delivery | Cost per retained user by link or code |
| Store listing (organic) | Installs without media spend | Needs the listing and ratings to be good | Page conversion and retention (see ASO guidelines) |
| Referral and invites | Users who arrive with context | Needs a product worth sharing | Invites per active user and retention of invitees |
For games, the same arithmetic applies with a longer retention day and a small share of payers: choose day 7 or day 30, put a revenue value on a retained user, and compute each channel's ceiling.
Keep bad installs out of the numbers
Retention-adjusted cost only works if the installs are real. Google's advertising help defines invalid clicks as clicks that do not reflect genuine interest, with examples of accidental clicks, automated traffic from bots and manual clicks meant to raise costs, and says its automated protections filter many of them and that credits may follow when invalid activity is found later (Google Ads Help). Platform filtering is not complete, so check your own data:
- Installs that never open. If a campaign's installs are far above its first opens, find out why before you pay.
- Retention that is zero or uniform. A day-1 retention of exactly zero for a large cohort, or a suspiciously flat rate across campaigns, deserves a look.
- Time between click and install. The Play Install Referrer API provides the click timestamp and the installation-begin timestamp for an install, so you can inspect that gap (Android Developers).
- Spikes at odd hours or from one source. A single publisher or campaign driving most of an install spike with weak retention is a reason to pause it and ask.
This article does not cover attribution matching or anti-fraud tooling in depth; that is the job of a mobile measurement partner.
Plan for less user-level data
From iOS 14.5, apps must receive the user's permission through Apple's App Tracking Transparency framework before they can track users or access the advertising identifier; without permission the identifier is all zeros (Apple). For acquisition, that means some user-level campaign data will be missing on iOS. Build the analysis on what you control: tag the channel in your own events, measure retention and revenue by channel, and read campaign-level results from the platforms.
Common mistakes
- Optimizing cost per install. In the sample it ranks the money-losing channel first.
- Using one blended number. The blended 27.9% return hides a +65.0% channel and a −10.0% one.
- Setting a target cost per install for everyone. Each channel has its own ceiling because each has its own retention.
- Counting installs as users. A reinstall or a device that never opens the app is not a user.
- Measuring retention too soon. Day-7 retention for an install that happened five days ago is not yet due.
- Forgetting the value assumption. $30 per retained user is an input you must justify from your own revenue data, not a fact.
How to run this analysis in TapCub
Take the three channels above and see how far TapCub gets you.
- See new users and next-day retention by channel. If the SDK sends
$channelon events, App analytics › Users › Channels shows each channel's average daily new users, next-day retention and share of active users, with a matrix of volume against retention. Users without a channel fall under (no channel). New users are people TapCub sees for the first time, so a reinstall does not count. - Go further than day one. In App analytics › Users › Retention, switch to week or month grain, or to Active retention, and use the channel filter in the header to see one channel at a time. Daily new-user retention ignores that filter. A day-7 figure per channel is not in this report, so use week-1 retention as the closest read, or compute day-7 from your own events.
- Import spend and read return. In All-platform analytics › Business › Channel ROI, import spend on the Costs tab (CSV columns day, channel, source, campaign, cost, currency, clicks, impressions). The page shows cost per click (spend ÷ sessions), cost per acquisition (spend ÷ purchases on the order ledger) and return on ad spend (revenue ÷ spend) by channel, source or campaign. Cost per acquisition here is per purchase, not per install, so take cost per install from your ad platform.
- Read install postbacks if you use an attribution partner. The Installs tab summarizes media source, organic versus non-organic and campaign from the partner's install postbacks.
TapCub does not match ad clicks to installs and is not an attribution provider. It measures what the people each channel brought in do afterwards, which is the half of the calculation the ad platform cannot see.
FAQ
What is a mobile user acquisition strategy?
It is the plan for getting people to install and keep using your app: which channels to buy or earn users from, the maximum you will pay in each, and the checks that confirm the users are worth the cost. A good one prices channels by retained users, not installs.
How do you measure mobile user acquisition?
Measure each step of the funnel: click-through, install rate, activation, day-1 and day-7 retention, payer rate. Then combine spend with those rates into cost per retained user and cost per payer by channel. Take the first two steps from the ad platform and the rest from your own events.
What is a good cost per install?
There is no number that is good for every app. A good cost per install is one under that channel's ceiling: the value of a retained user times the channel's retention. In the sample, $2.40 is the ceiling for paid social, $6.60 for search ads and $0.90 for the incentivized network.
How do mobile user acquisition campaigns differ from organic acquisition?
Campaigns are paid and scale with spend, so their cost per retained user must stay below the value of a retained user. Organic installs come from the store listing, referrals and word of mouth and cost no media spend, but they still need retention checks to show the audience is right.
How do I stop fake or low-quality installs?
Compare installs with first opens and retention by campaign, inspect the gap between click and install, and pause sources with high install volume and near-zero retention. Platforms filter some invalid activity and may credit later, but filtering is not complete, so your own checks matter.
See also: Deferred Deep Linking: How It Works and How to Track It.
See also: Paid User Acquisition: Channels Costs and CAC Payback.
See also: What is click-to-install time (CTIT)? How short CTIT flags install fraud.
Sources
- Apple, User Privacy and Data Use (App Tracking Transparency from iOS 14.5; advertising identifier all zeros without permission). Checked 2026-11-17.
- Android Developers, Play Install Referrer API (referrer URL, click and install-begin timestamps). Checked 2026-11-17.
- Google Ads Help, Invalid clicks: Definition (invalid clicks, automated filtering and credits). Checked 2026-11-17.
Was this article helpful?
We use your answers to fix and expand this page.
Couldn’t send. Please try again in a minute.
Thanks for the feedback. We’ll use it to improve this page.You’ve already sent feedback on this page. Thanks.

Product Experience Specialist
Explores usability, user journeys, and feature adoption through practical examples of onboarding and everyday product use.