Try it on your own data
Every report in this article is in the free plan. One snippet for web and apps, up to 10 sites.
Start freePaid user acquisition is paying for the clicks, installs or leads that bring new users, and it should be judged by CAC payback: months for a paying customer to earn back what you spent on them. In the sample, paid search cost $828 per customer and paid back in 12.4 months once churn is counted.
What you will learn
- Rank channels by churn-adjusted CAC payback, not cost per click: in the sample, social had the cheaper signup ($60) but the higher CAC ($1,000)
- Use gross profit and the same time window for every channel; benchmarks start at under 12 months for SMB and under 18 for mid-market
- Lower churn is worth more than a lower click price: 2% instead of 3% monthly churn cut paid-search payback from 12.4 to 11.6 months
What is paid user acquisition, and what does it cost to judge it?
Paid user acquisition means paying for the click, install, lead or sponsorship that brings a new user to your product, as opposed to waiting for search, referrals or word of mouth. The broader term, user acquisition, covers all of the ways you get new users; this guide is about the paid part and one question: how long does a paying customer take to earn back what you spent to get them?
That time is the CAC payback period, and it is the number that decides whether a channel can be scaled. Clicks and installs are cheap to measure and easy to celebrate, but a channel that brings thousands of visitors and recovers its cost in 30 months is a loan you cannot afford. If your product is a mobile app, mobile user acquisition covers the install-specific mechanics; the arithmetic below works for any product that charges a recurring fee.
How do you calculate CAC and payback?
Four formulas are enough, and each can be checked against your own data:
Cost per paying customer (CAC) = cost per click ÷ (visit-to-signup rate × signup-to-paying rate)
Monthly gross profit per customer = monthly revenue per customer × gross margin
Simple payback (months) = CAC ÷ monthly gross profit per customer
Churn-adjusted payback: the month in which cumulative gross profit, which shrinks each month as customers leave, first reaches CAC. With monthly churn c and monthly gross profit g, cumulative profit after n months is g × (1 − (1 − c)^n) ÷ c, so payback is the first month where that reaches CAC.
Use gross profit, not revenue: revenue ignores the cost of serving the customer, and a 100% margin assumption shortens payback by an amount you cannot see. Use the same time window for every channel, otherwise a channel measured over 60 days looks worse than one measured over 10 days.
What does a good payback look like?
Two published rules of thumb are worth keeping, both for subscription software:
- Bessemer Venture Partners gives a target per segment: CAC payback under 12 months for SMB customers, under 18 months for mid-market and under 24 for enterprise. It reports the average in the $1–10 million ARR bucket at 15 months, rising as companies mature, and recommends investing when the ratio of customer lifetime value to CAC is 3x or higher.
- David Skok (For Entrepreneurs) writes that profitability is thin when the time to recover CAC extends beyond 12 months, and that a lifetime-value-to-CAC ratio above 3 is a guideline; he stresses these are guidelines and that many healthy early-stage businesses miss them at first. Large companies can accept longer paybacks because they access cheaper capital; startups usually find capital expensive.
Neither number is a law. Both are useful as a starting line: if a channel is under 12 months at SMB prices, scale it; between 12 and 18 months, scale carefully and work on conversion and churn; beyond that, you need a reason (large contracts, low churn, or cheap capital).
For channel prices, the only dated cross-industry figures we could verify are LocaliQ's 2026 Google Ads benchmarks: an average cost per click of $5.42, a conversion rate of 8.18% and a cost per lead of $66.69 across industries. Its Business Services row reads $5.87 per click, 4.85% conversion and $93.69 per lead. These are lead figures, not paying customers, so you still need your own lead-to-customer rate. Treat every vendor benchmark as a sanity check on the order of magnitude.
How do channels compare? A worked example
Sample data: a subscription product charges $99 a month at an 80% gross margin, so gross profit is $79.20 a month per customer. Monthly churn is 3%. Paid search uses the LocaliQ 2026 averages for cost per click ($5.42) and visit-to-lead conversion (8.18%); the lead-to-paying rate and all inputs for the other three channels are our assumptions, labelled as such.
| Channel | Cost per click | Visit to signup | Signup to paying | Cost per signup | CAC | Simple payback | Churn-adjusted payback |
|---|---|---|---|---|---|---|---|
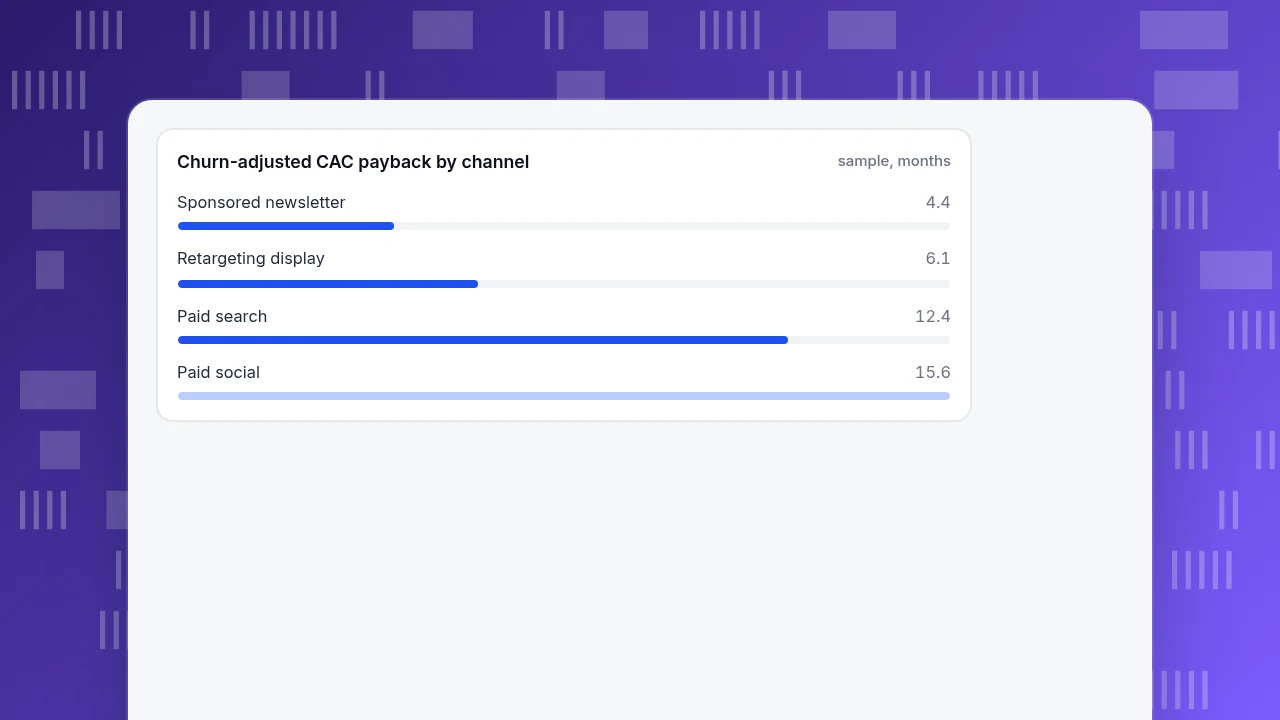
| Paid search | $5.42 | 8.18% | 8% | $66 | $828 | 10.5 months | 12.4 months |
| Paid social | $1.80 | 3.0% | 6% | $60 | $1,000 | 12.6 months | 15.6 months |
| Retargeting display | $0.90 | 2.0% | 10% | $45 | $450 | 5.7 months | 6.1 months |
| Sponsored newsletter | $1.33 | 5.0% | 8% | $27 | $333 | 4.2 months | 4.4 months |
How the numbers are built, for paid search: CAC = 5.42 ÷ (0.0818 × 0.08) = $828; simple payback = 828 ÷ 79.20 = 10.5 months; with 3% churn, cumulative gross profit is $808 at month 12 and $968 at month 15, so it crosses $828 during month 13.
Reading the table: the cheapest signup is not the cheapest customer, and the cheapest customer is not the one to scale. Paid social has a lower cost per signup ($60) than paid search ($66) but a higher CAC ($1,000 against $828) because fewer signups become paying. Retargeting and the newsletter look best, but they draw on a limited audience: retargeting only reaches people who already visited, and a newsletter has a fixed readership, so the right move is to fill them to capacity first and not expect to scale them. Paid search, at 12.4 months churn-adjusted, is just inside Bessemer's 12-to-18-month mid-market band and above its SMB line of 12, so it needs a conversion improvement before more budget.
Churn-adjusted CAC payback by channel
sample, monthsHow does the cash look month by month?
A cohort view makes the churn effect visible. For one paid-search customer acquired for $828 with $79.20 a month gross profit and 3% churn (sample data):
| Month | Cumulative gross profit | Net of CAC |
|---|---|---|
| 6 | $441 | −$387 |
| 10 | $693 | −$135 |
| 12 | $808 | −$20 |
| 15 | $968 | +$140 |
The channel is still $20 short of break-even at month 12 and passes it in month 13. Two consequences follow. First, the money is spent now and returns over a year, so a growth budget needs a cash plan that can carry about 12 months of payback on every cohort. Second, a lower churn rate is worth more than a lower click price: churn at 2% instead of 3% brings payback from 12.4 to 11.6 months without touching the ad account.
| Month | Cumulative gross profit | Net of $828 CAC |
|---|---|---|
| 6 | $441 | −$387 |
| 10 | $693 | −$135 |
| 12 | $808 | −$20 |
| 15 | $968 | +$140 |
Sample data: $79.20 monthly gross profit, 3% monthly churn.
How do you decide where to put the next dollar?
Turn the table into rules you can check each month:
- Rank channels by churn-adjusted payback, not by cost per click. The click price is an input; payback is the result.
- Scale only channels under your payback limit. For a subscription product at SMB prices, use 12 months as the starting limit; for larger contracts use 18 or 24 as Bessemer's segment targets suggest.
- Raise spend in steps and re-measure. Each budget step can raise the marginal CAC, because the most responsive audience is usually reached first. Stop when the marginal payback passes your limit.
- Give every campaign the same window. Compare 30-day, 60-day or 90-day conversion for all channels, not different windows for each.
- Keep an eye on the blended number. Total spend divided by all new customers (paid and organic) is always lower than paid CAC; use it for overall health, not to justify a channel.
Which mistakes make paid acquisition look better than it is?
- Counting signups, not paying customers. The cost per signup in the table is half the story; the signup-to-paying rate decides the CAC.
- Using revenue instead of gross profit. At an 80% margin, revenue-based payback is 20% too short.
- Ignoring churn. In the example it adds almost two months.
- Trusting one platform's conversion count. Ad platforms report the conversions they can attribute to themselves, and channels can claim the same customer. Reconcile against your own orders.
- Crediting only the last click. Retargeting often claims customers an earlier channel started. Compare several attribution views before cutting an earlier channel.
How to track paid acquisition in TapCub
Here is how a team would put the example's channels into one view. TapCub does not buy ads, bid or optimise campaigns, and it is not an install-attribution service; it records what the spend produced once visitors arrive.
- Tag every campaign. Use UTM source, medium and campaign on each ad. Web analytics › Sources groups visitors by channel, source and UTM, and treats visits with
gclid,msclkidand similar click IDs as paid search. - Enter the spend. In All-platform analytics › Business › Channel ROI, open the Costs tab and add spend by day, channel, source and campaign, one row at a time or by CSV import.
- Read cost per click and per acquisition. The ROI tab computes cost per click (spend ÷ sessions) and cost per acquisition (spend ÷ purchases on the order ledger), and groups by channel, source or campaign. If your product charges subscriptions, make sure the purchase event reflects a paying customer; gross margin and churn stay in your own spreadsheet.
- Compare attribution models side by side. In All-platform analytics › Behavior › Behavior analysis, select first, last, linear, position and time-decay models together; each becomes a column, so a channel that mostly assists shows up. The lookback window defaults to 30 days.
- Count only real people. Bots and AI crawlers are counted separately, so crawler visits do not inflate sessions and understate your cost per click.
FAQ
What is paid user acquisition?
Paid user acquisition is paying for the clicks, installs, leads or sponsorships that bring new users to a product, as opposed to organic channels such as search, referrals and word of mouth. Its key measure is how long a paying customer takes to earn back the cost of acquiring them.
How do you calculate CAC payback?
Divide CAC by monthly gross profit per customer. With a $828 CAC and $79.20 of monthly gross profit, simple payback is 10.5 months. To include churn, find the month in which cumulative gross profit, shrinking by the monthly churn rate, first reaches CAC; at 3% churn that is month 13.
What is a good CAC payback period?
For subscription software, Bessemer Venture Partners suggests under 12 months for SMB, under 18 for mid-market and under 24 for enterprise, and reports 15 months as the average in the $1–10 million ARR bucket. David Skok calls recovery beyond 12 months thin on profitability. Both call these guidelines.
What is the difference between CAC and cost per lead?
Cost per lead counts everyone who signed up or filled a form; CAC counts only those who became paying customers. In the example, paid search cost $66 per signup but $828 per paying customer, because only 8% of signups paid.
Which paid channel has the lowest CAC?
It depends on your product and audience, so there is no fixed ranking. In the sample, a sponsored newsletter had the lowest CAC at $333 and paid social the highest at $1,000, but small audiences limit how far the cheap channels scale. Measure your own channels over the same window.
Sources
- Bessemer Venture Partners. Scaling to $100 Million — CAC payback targets by segment (SMB under 12, mid-market under 18, enterprise under 24 months) and the 15-month average. Checked 2026-11-20.
- David Skok, For Entrepreneurs. SaaS Metrics 2.0 — months to recover CAC, LTV to CAC above 3, guideline caveats. Checked 2026-11-20.
- LocaliQ. Search advertising benchmarks — 2026 Google Ads averages: CPC $5.42, conversion rate 8.18%, cost per lead $66.69 (vendor data from customer campaigns). Checked 2026-11-20.
Was this article helpful?
We use your answers to fix and expand this page.
Couldn’t send. Please try again in a minute.
Thanks for the feedback. We’ll use it to improve this page.You’ve already sent feedback on this page. Thanks.

Product Adoption Consultant
Explores customer onboarding, live conversations, and self-service, turning common usage questions into practical guidance and improvements.