Try it on your own data
Every report in this article is in the free plan. One snippet for web and apps, up to 10 sites.
Start freeYes, page speed affects SEO, but through two narrow routes: Google's page experience signals, which act as a tie-breaker between equally relevant pages, and crawl capacity, which only limits very large sites. Speed matters most when your real-user Core Web Vitals are in the poor range. Check them first, then decide whether to optimize.
What you will learn
- Google uses Core Web Vitals in ranking, but relevance still comes first: speed is a tie-breaker, not a trump card
- If all three metrics are good at the 75th percentile on mobile and desktop, stop; if one is poor on your top landing pages, fix it
- Measure the effect on your own site: in the sample, a 4.2 s to 2.4 s LCP fix lifted conversion 10.8% against unchanged pages
What does Google actually say about page speed and rankings?
Google's page experience documentation is the place to start, because most claims online about page speed are stronger than what it says. Three points matter.
- Core Web Vitals are used by Google's ranking systems. Loading, interactivity and visual stability are measured and can influence results.
- There is no single "page experience signal." Google describes page experience as a set of aspects, and says the others do not directly help a page rank higher.
- Relevance comes first. Google says its systems still try to show the most relevant content even when page experience is sub-par. When many pages are equally helpful, a great page experience can contribute to success.
Read together, that is a tie-breaker, not a trump card. A slow page with the best answer can still rank above a fast page with a thin one. A fast page does not make weak content rank. The useful question is not "is speed a ranking factor?" but "is my site slow enough, on enough important pages, that it could cost me?" The rest of this article gives you a way to answer it with your own data.
Which three metrics count, and where are the thresholds?
The Core Web Vitals are three metrics. Each is assessed at the 75th percentile of real page loads, which means at least 75% of visits must meet the target for the page to rate "good", measured separately for mobile and desktop.
| Metric | What it measures | Good | Needs improvement | Poor |
|---|---|---|---|---|
| Largest Contentful Paint (LCP) | How long until the main content is visible | ≤ 2.5 s | 2.5–4 s | > 4 s |
| Interaction to Next Paint (INP) | How quickly the page responds to taps and clicks | ≤ 200 ms | 200–500 ms | > 500 ms |
| Cumulative Layout Shift (CLS) | How much the layout jumps while loading | ≤ 0.1 | 0.1–0.25 | > 0.25 |
Two details trip people up. First, these numbers come from field data, meaning real visitors' browsers (Google's Search Console report uses the Chrome UX Report over a 28-day window), not from a one-off lab test. A page can score 95 in a lab run and still be "poor" in the field if your visitors are on slow phones. Second, a URL group takes the status of its worst metric: good LCP and poor CLS is a poor page.
Other timings such as first contentful paint and time to first byte are useful for diagnosis, but they are not Core Web Vitals. For definitions of each metric, see Largest Contentful Paint, Interaction to Next Paint, Cumulative Layout Shift and the umbrella entry for Web Vitals.
Route one: speed as a ranking input — when does it matter?
Because Google calls this a tie-breaking aspect among helpful results, the rule of thumb is about where you sit relative to the thresholds, not how many milliseconds you can shave:
- If all three metrics are already "good" on mobile and desktop, further speed work has little to offer in search. Stop and spend the time on content or snippets.
- If one metric is "needs improvement", fix it when it is cheap, but do not expect a ranking change by itself.
- If a metric is "poor" on pages that drive your organic traffic, this is where speed can cost you, and where user behavior also suffers (see the example below).
- If your pages are poor but you hold unique, highly relevant content, expect little ranking change either way. You still lose visitors who leave before the page loads.
That last point is the real reason to care. Even where ranking effects are small, speed changes what happens after the click: visitors who wait leave, and fewer of them convert. That is a business reason, independent of Google.
Route two: speed and crawling — does it affect small sites?
Google's crawl budget guide describes a crawl capacity limit: how much time Google will spend holding connections open to your server. The guide says the limit rises if the site responds quickly and consistently, and falls if the site slows down or returns server errors. It also says the guide is aimed at large sites, roughly 1 million unique pages that change weekly, or 10,000+ pages that change daily, and sites with many URLs stuck in "Discovered - currently not indexed". Smaller sites generally do not need to worry about crawl budget.
Two rules follow:
- Under about 10,000 pages, crawl capacity is rarely your limit. Do not justify speed work with "Google will crawl us more."
- Over that size, response time and 5xx errors do matter. Check the average response time and host status in Search Console's Crawl Stats report, and treat a sudden jump as a server problem before a content problem.
Fast responses help in a second way: when Google can fetch new and updated pages quickly, they are discovered sooner. For the broader picture of what budgets and limits mean, see crawl budget.
Should you spend time on speed at all? A decision table
Start with your own field data for the top 20 landing pages (by organic sessions), not with a lab score. Then use this table:
| What you see | What it means | What to do |
|---|---|---|
| All three metrics "good" at P75, mobile and desktop | Speed is not what holds you back in search | Move on; re-check monthly |
| LCP "needs improvement" (2.5–4 s) on a few pages | Small risk, small gain | Fix the cheapest causes (image size, server response) |
| LCP or INP "poor" on pages with most of your traffic | Real risk to rankings and conversion | Make this the project for the quarter |
| CLS "poor" only on one template | Contained problem | Fix the template once: reserve space for images, ads and embeds |
| Good lab score, poor field data | The test device is not your visitor | Trust field data; segment by device and country |
| No field data (too little traffic) | Google cannot rate the page either | Use a lab test for diagnosis, but there is no ranking verdict to chase |
| Route | How speed matters | When it matters |
|---|---|---|
| Ranking input | Core Web Vitals are used by Google's ranking systems, mainly between equally helpful pages | When a metric is poor on pages that compete for the same query |
| Crawl capacity | Fast, steady responses raise how long Google crawls your server; slow ones and 5xx errors lower it | Sites with roughly 10,000+ pages changing daily or 1 million+ changing weekly |
| Visitor behavior (not a Google signal) | Visitors who wait leave and convert less | Any site where sessions with slow loads are a large share |
Scope figures from Google's crawl budget guide; ranking wording from Google's page experience page.
What does a speed fix do for conversion? A worked example
Google has not published conversion numbers for speed, so measure your own. Here is the method with sample data.
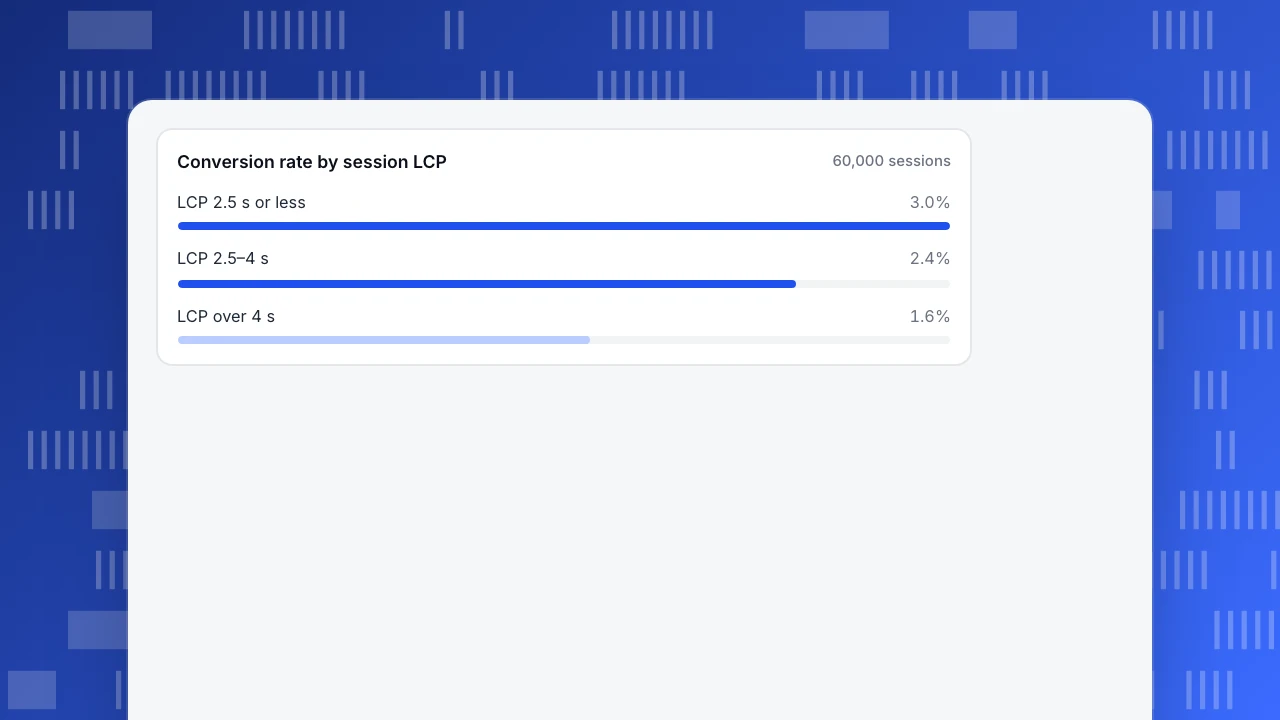
Step 1: Group sessions by their own LCP. Sample data: 60,000 mobile sessions on product pages in one month.
| LCP of the session | Sessions | Orders | Conversion rate |
|---|---|---|---|
| 2.5 s or less | 18,000 | 540 | 3.0% |
| 2.5–4 s | 22,000 | 528 | 2.4% |
| Over 4 s | 20,000 | 320 | 1.6% |
| All sessions | 60,000 | 1,388 | 2.31% |
Overall conversion is 1,388 ÷ 60,000 = 2.31%. The slowest third converts at 1.6%, almost half the rate of the fastest group. If the 20,000 slow sessions converted like the middle group (2.4%), the store would gain 20,000 × 2.4% − 320 = 160 orders per month. At the fast group's rate it would gain 280. Treat 160 as the cautious estimate.
Step 2: Do not trust Step 1 alone. Fast sessions happen on better phones and networks, and those visitors may convert more anyway. So test the fix as a before-and-after against pages you did not change.
Sample data: the product template's p75 LCP goes from 4.2 s to 2.4 s. Thirty thousand sessions per month on each side.
| Before | After | Change | |
|---|---|---|---|
| Optimized pages: orders per 30,000 sessions | 660 (2.20%) | 744 (2.48%) | +12.7% |
| Unchanged pages: orders per 30,000 sessions | 690 (2.30%) | 702 (2.34%) | +1.7% |
Net of the control group's drift, the improvement is 1.127 ÷ 1.017 − 1 = +10.8%, about 72 extra orders per 30,000 sessions. A two-proportion test on the optimized pages gives z ≈ 2.27 (p ≈ 0.023), so it is unlikely to be noise, but one month is a thin base: check that it holds for a second month.
For an outside reference, Vodafone ran a controlled A/B test on a landing page, splitting traffic 50/50, where the only difference was Web Vitals work. Its LCP improved 31% and sales rose 8% in the optimized version. Different site, different baseline: use it as evidence that the effect exists, not as a number to expect.
Conversion rate by session LCP
60,000 sessionsHow do you improve website speed? A short list in priority order
For the people who searched "how to improve website speed" or "how to increase site speed": order the work by what moves a poor metric, not by what is easiest.
- Find your slow pages first. Use real-user data by page, and sort by sessions × share of poor loads. Ten pages usually carry most of the damage.
- LCP: find the one element. It is usually a hero image, a large heading or a banner. Resize and compress it, serve a modern format, and do not lazy-load it. If the server is slow to respond, fix that before images: the browser cannot start rendering until the first byte arrives.
- LCP: remove what blocks rendering. Scripts and stylesheets loaded in the head delay everything. Defer what is not needed for the first screen.
- INP: shorten long tasks. Heavy scripts run on the main thread and make taps feel slow. Split work, delay third-party tags, and test on a mid-range phone.
- CLS: reserve space. Give images, embeds and ad slots fixed dimensions so nothing jumps when they load.
- Verify with field data. Search Console's Core Web Vitals report uses a 28-day window, so a fix takes up to four weeks to show fully. Mark the release date on your charts and compare against unchanged pages as in the example above.
For a longer list of causes and targets, see website performance metrics and, for what load time counts as good, good page load time.
How to check this in TapCub
Take the product-page example above. Here is how you would run the same check in TapCub.
- Open Monitoring › Performance. The cards show real-visitor LCP, INP and CLS with the good and poor thresholds above, plus first contentful paint and time to first byte. Switch the cards to P75 and read the share rated good first.
- Use the breakdown by page, country, device, browser or operating system. The Slowest pages list is sorted by P75 LCP, and a 0–100 score combines LCP, INP and CLS. Start with the pages at the top.
- Open Web analytics › Pages and look at the same paths: visitors, bounce rate and time on page show whether the slow pages are also losing people. The goal is to see speed and behavior side by side for one URL.
- Open Monitoring › Search performance (after connecting Google Search Console or Bing Webmaster) to see impressions and clicks for those pages. Search data is usually 1–3 days late.
- Add a Release note in Configuration › Annotations on the day you ship the fix, so the before-and-after window is visible on your charts.
Three limits to know. The Performance page uses only metrics reported by visitors' browsers: if the script is blocked or an old snippet is installed, the page is empty, and TapCub does not substitute server time. It has no previous-period comparison and no Apdex score. And TapCub does not speed your site up or run lab audits: it only measures. For a step-by-step setup, see the help article on checking Core Web Vitals.
FAQ
Is page speed a ranking factor?
Yes, in a limited way. Google says Core Web Vitals are used by its ranking systems, but page experience is not a single signal, and relevance still comes first. It acts mainly as a tie-breaker between similarly helpful pages.
Does page speed matter for small websites?
For rankings, usually less than content does, but a page in the "poor" range loses visitors regardless. For crawling, small sites rarely hit a limit: Google aims its crawl budget guide at sites with at least 10,000 changing pages.
What is a good page speed for SEO?
Aim for all three Core Web Vitals to be "good" at the 75th percentile on mobile and desktop: LCP of 2.5 seconds or less, INP of 200 milliseconds or less and CLS of 0.1 or less. Beyond that line, extra speed has diminishing SEO value.
Do Core Web Vitals matter more than content?
No. Google says it tries to show the most relevant content even when page experience is poor. Speed wins only when several pages answer the query equally well.
How long does it take to see a speed fix in Search Console?
Up to about four weeks. Search Console groups field data over a 28-day window, so old slow visits stay in the average until they age out. Your own analytics shows a change sooner.
See also: How to Optimize Website Performance: Measure, Find the Slow Part, Fix It.
See also: Mobile Search Engine Optimization: Rendering, Speed and Tap Checks.
See also: HTTP/3 Explained: What It Changes for Page Speed and How to Check It.
Sources
- Understanding page experience in Google Search results (Google Search Central)
- Core Web Vitals report (Search Console Help: field data, 28-day window, thresholds, 75th percentile, worst-metric rule)
- Optimize Largest Contentful Paint and Interaction to Next Paint (web.dev)
- Managing your crawl budget (Google Search Central)
- Vodafone: 31% improvement in LCP increased sales by 8% (web.dev)
Was this article helpful?
We use your answers to fix and expand this page.
Couldn’t send. Please try again in a minute.
Thanks for the feedback. We’ll use it to improve this page.You’ve already sent feedback on this page. Thanks.

Data Engineer
Writes about event design, data quality, and collection workflows, with verifiable implementation methods for reliable analytics.