Try it on your own data
Every report in this article is in the free plan. One snippet for web and apps, up to 10 sites.
Start freeTo optimize website performance, measure real visitors first, pick the page where slowness costs most, split its Largest Contentful Paint into four parts and fix only the part that is out of proportion. This guide gives that order, a ranking score for pages, a recomputed example that takes LCP from 4.1 s to 2.4 s, and the checks that confirm the fix.
What you will learn
- Use real-user data at the 75th percentile as the baseline; lab runs on a fast machine are for debugging
- Rank pages by pageviews × seconds over the 2.5 s threshold, then adjust for what a visit is worth
- Split LCP into time to first byte, load delay, load duration and render delay, and fix the one out of proportion
What does it mean to optimize website performance?
Optimizing website performance means making the pages your real visitors use load quickly, respond to taps and clicks, and stay visually stable. It is measured, not felt. Google's Core Web Vitals give the three numbers most teams start with, each judged at the 75th percentile of real page loads (so the slower quarter of visits counts):
| Metric | What it measures | Good | Needs improvement | Poor |
|---|---|---|---|---|
| Largest Contentful Paint (LCP) | When the main content appears | ≤ 2.5 s | 2.5 to 4 s | > 4 s |
| Interaction to Next Paint (INP) | How fast the page responds to input | ≤ 200 ms | 200 to 500 ms | > 500 ms |
| Cumulative Layout Shift (CLS) | How much the layout jumps | ≤ 0.1 | 0.1 to 0.25 | > 0.25 |
The rest of this guide is a sequence: measure, choose a page, find the slowest part, fix it, check, keep watching. The ordering is the point. Most wasted effort in performance work comes from fixing something (compressing every image, switching hosts) before knowing which part of the load is actually slow. For the definitions behind each metric see website performance metrics, and for the link to rankings see page speed and SEO.
How do you measure performance before changing anything?
Use field data, numbers collected from real visitors' browsers, as your baseline. web.dev recommends relying on real-user data over lab tools, because a lab run on your fast laptop may not match what visitors on mid-range phones experience. Lab tools still help for debugging a specific page; they are not the scoreboard.
Record three things before you touch the site:
- P75 for LCP, INP and CLS, overall and for your five busiest pages.
- The share of page loads rated good for each metric.
- The date and time, so later numbers can be compared fairly.
Percentiles jump when a page has few samples, so ignore pages with only a handful of loads. If you want to know why a page feels slow rather than just that it is, slow website walks through the causes.
Which page should you fix first?
Not every slow page deserves the first day. A simple score ranks them: pageviews × seconds over the 2.5 s LCP threshold. Sample data:
| Page | Pageviews per month | P75 LCP | Seconds over 2.5 s | Score |
|---|---|---|---|---|
| /product/ pages | 18,000 | 3.6 s | 1.1 | 19,800 |
| /pricing | 12,000 | 4.1 s | 1.6 | 19,200 |
| /checkout | 3,000 | 5.2 s | 2.7 | 8,100 |
| /blog/ pages | 30,000 | 2.3 s | 0 | 0 |
By score, product pages and pricing are close, and the blog needs nothing. Checkout scores lowest because it has the fewest views, but each visitor there is close to paying, so adjust the ranking by what a visit is worth. Pricing is the likely first target: nearly as many slow views as product pages, and visitors there are closer to a decision.
| Symptom | Likely cause | Fix |
|---|---|---|
| Buttons feel laggy (high INP) | Long tasks block the main thread | Split long scripts, defer non-critical work |
| Screen updates late after a tap | Heavy rendering after the handler | Reduce DOM size, avoid forced layout |
| Content jumps as images load | Images without width and height | Set dimensions or aspect ratio |
| Banner pushes the page down | Late-injected element above content | Reserve its space |
| Text flashes as fonts load | Font swap changes text size | Preload the font, match fallback metrics |
Test the cause before the fix: turning off one third-party script and re-measuring shows what it costs.
How do you find the slowest part of the load?
Break LCP into four sub-parts and look for the one that is out of proportion. web.dev's guidance gives rough shares of the total: time to first byte about 40%, resource load delay under 10%, resource load duration about 40% and element render delay under 10%. These are guidelines, not strict rules.
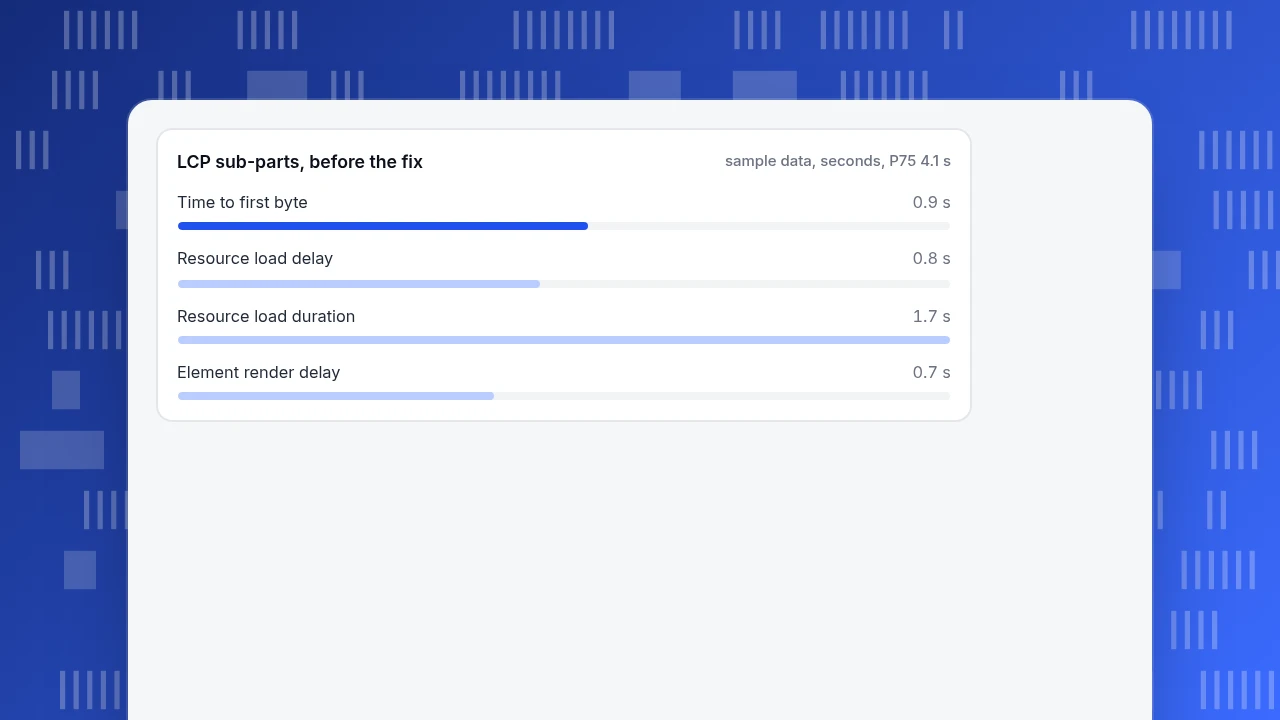
Sample data for the pricing page, where P75 LCP is 4.1 s:
| Sub-part | Seconds | Share of 4.1 s | Guideline | Verdict |
|---|---|---|---|---|
| Time to first byte | 0.9 | 22% | about 40% | Slightly over the 0.8 s guideline, not the bottleneck |
| Resource load delay | 0.8 | 20% | under 10% | Too high |
| Resource load duration | 1.7 | 41% | about 40% | Large in seconds |
| Element render delay | 0.7 | 17% | under 10% | Too high |
| Total | 4.1 | 100% |
Reading the table: the hero image starts loading 0.8 s late (it is discovered late), takes 1.7 s to download (it is big), and then waits 0.7 s to be painted (something blocks rendering). Three fixes, each aimed at one row:
- Load delay 0.8 → 0.2 s: make the image discoverable early, with a preload hint and a high fetch priority, and do not lazy-load the hero.
- Load duration 1.7 → 0.9 s: resize it to the displayed size and use a modern format.
- Render delay 0.7 → 0.4 s: reduce render-blocking CSS and scripts above the fold.
New total: 0.9 + 0.2 + 0.9 + 0.4 = 2.4 s, inside the good range. Note what we did not touch: time to first byte. Moving hosts would have cost effort and changed little here: 0.9 s is close to the 0.8 s guideline, and the three other rows hold the excess.
LCP sub-parts, before the fix
sample data, seconds, P75 4.1 sHow do you fix slow responses and layout shifts?
INP and CLS need their own diagnosis. INP is the time from an input to the next frame, made up of input delay, processing time and presentation delay. CLS comes from elements that change size or position after they appear. Use this table:
| Symptom | Likely cause | Fix |
|---|---|---|
| Buttons feel laggy (high INP) | Long tasks on the main thread block input | Split long scripts, defer non-critical work, remove unused JavaScript |
| Tap works but screen updates late | Heavy rendering after the handler runs | Reduce DOM size, avoid forcing layout in handlers |
| Content jumps as images load | Images without width and height | Set dimensions or an aspect ratio |
| Banner pushes the page down | Late-injected element above content | Reserve its space, or put it below the fold |
| Text flashes when fonts load | Font swap changes text size | Preload the font and match fallback metrics |
Test the claim, not the guess. Turning off one third-party script (a chat widget, a tag manager container) and re-measuring is the quickest way to learn what it costs.
What about the server, caching and third-party scripts?
If the first sub-part dominates (time to first byte over about 0.8 s, which web.dev lists as a good threshold), the problem is before the browser: slow server work, no caching, or a distant server. Typical fixes are caching pages or API responses, a content delivery network and reducing back-end work per request. If scripts you do not control dominate the main thread, ask for each: does this earn its cost? A script that makes no revenue and is used by nobody is free to remove.
How do you verify a fix and stop regressions?
Field data lags: the 75th percentile moves as the new loads replace the old ones. So:
- Mark the release date, then compare equal-length periods before and after.
- Check P75 and the share rated good, not only the average. An average of 2.4 s can hide a slow quarter of loads.
- Re-check the pages you did not touch, in case a shared script changed.
- Add a threshold alert so a regression is noticed within a day, not a quarter.
What are the most common performance mistakes?
- Optimizing before measuring. Compressing every image when the delay is in rendering.
- Trusting a lab score on a fast machine. Real visitors' devices are slower.
- Reading the average. It hides the slow tail that P75 shows.
- Fixing the wrong page. Rank by traffic and distance over the threshold.
- Lazy-loading the hero image. It delays the very element LCP measures.
- Adding a fix without verifying. Without a before and after, you cannot tell what helped.
How to track performance in TapCub
Take the pricing page above. TapCub shows the real-user numbers; it does not audit your code or give fix instructions, so changes happen in your own build. The steps:
- Read the scoreboard. Open Monitoring › Performance. The five cards (LCP, CLS, INP, first contentful paint and time to first byte) use the same thresholds as above, and you can switch the card between P75, P95, median and average. Start with P75 and the share rated good.
- Find the slow paths. Break down by page, country, device, browser or operating system. The Slowest pages list is sorted by P75 LCP, which maps straight onto the score table.
- See where time goes. Load timing splits one load into backend (time to first byte), network transfer and frontend render, which tells you which of the first and last sub-parts to chase.
- Check whether the slow pages also lose people. Compare with Web analytics › Pages for bounce rate and exits, and use Web analytics › Goals for conversion.
- Mark releases. Add an annotation in Configuration › Annotations on the deploy date, and watch for errors in Monitoring › Errors.
- Know the boundary. The page is empty if the script is blocked or an old snippet does not collect these metrics; it has no previous-period comparison; the 0 to 100 score combines only LCP, INP and CLS; and TapCub has no Apdex metric and does not run lab audits.
FAQ
What is the first step in optimizing website performance?
Measure with real-user data. Record P75 for LCP, INP and CLS and the share of loads rated good, overall and for your busiest pages. Then pick the page by traffic multiplied by how far it is over the threshold.
What are good Core Web Vitals scores?
At the 75th percentile of page loads: LCP at most 2.5 seconds, INP at most 200 milliseconds and CLS at most 0.1. Above 4 seconds, 500 milliseconds and 0.25 respectively is rated poor.
Why is my site slow even after compressing images?
Because image size is only one part of LCP. The time may be in time to first byte, in discovering the image late, or in render-blocking code. Break LCP into its four sub-parts before choosing a fix.
How long do performance fixes take to show in the data?
Field data is a rolling window of real visits, so the 75th percentile shifts gradually as new loads replace old ones. Compare equal-length periods after the release date and give it enough traffic, usually a few days to a few weeks depending on volume.
Does page speed affect conversion rate?
It can, but the effect varies by site, so measure yours: compare goal rate for fast and slow loads of the same page, and treat the gap as indicative, since visitors on slow connections also differ in other ways.
See also: Expires Header and Cache-Control: What to Set and How to Check.
See also: HTTP/3 Explained: What It Changes for Page Speed and How to Check It.
Sources
- web.dev. Web Vitals. Core Web Vitals metrics and thresholds at the 75th percentile.
- web.dev. Optimize Largest Contentful Paint. The four LCP sub-parts and their guideline shares; field data over lab data.
- web.dev. Optimize Interaction to Next Paint. Input delay, processing and presentation delay.
- web.dev. Optimize Cumulative Layout Shift. Reserving space for images and late content.
- web.dev. Time to First Byte (TTFB). The 0.8 second guideline.
Was this article helpful?
We use your answers to fix and expand this page.
Couldn’t send. Please try again in a minute.
Thanks for the feedback. We’ll use it to improve this page.You’ve already sent feedback on this page. Thanks.

Customer Experience Consultant
Writes about live chat, visitor conversations, and self-service, sharing practical ways to make customer communication clearer and more effective.