Try it on your own data
Every report in this article is in the free plan. One snippet for web and apps, up to 10 sites.
Start freeTo segment your audience, pick one dimension you can act on, such as source, behaviour or lifecycle stage, define the rule with a time window and then test that the groups really behave differently before building on them. In the worked example, device and country made no difference to conversion, while whether a visitor viewed pricing separated 12.0% from 3.0%.
What you will learn
- Start with one dimension and one decision; a segment is only useful if you would do something different for it
- Test the split: in the sample, device (z = −0.48) and country (z = −0.03) did not differ, while viewed-pricing did (z = 16.47)
- Keep one segment per distinct action, usually 3 to 5, and review them each quarter
What does it mean to segment your audience?
Segmenting your audience means splitting people into groups that share a characteristic, so you can treat each group differently. The idea is old: Wendell Smith described market segmentation in 1956 as adjusting a product and its marketing to the differing demands of groups of customers, rather than bending demand to fit one product (source).
What turns a split into a segmentation is a test of action. A segment is only useful if you would do something different for it: a different message, page, offer, support route or follow-up. "Visitors aged 25–34" is a label. "Visitors who looked at pricing and did not buy" is a segment, because you can show them something specific.
For definitions and the main types, see the audience segmentation glossary entry and behavioral segmentation. This guide is the how-to: choose one dimension, split, then check the groups really behave differently before you build anything on them.
Which dimension should you start with?
Choose the dimension by the decision you want to make, then by the data you already have. Six options cover most cases:
| Dimension | Example split | Data you need | Usually actionable? |
|---|---|---|---|
| Geography | Country, region, language | Location from the visit | When prices, shipping, language or hours differ |
| Demographics | Age, role, company size | Profile data you collected | Only if you actually hold it and it changes the offer |
| Acquisition source | Channel, campaign, referrer | UTM and referrer data | Yes, for budget and landing pages |
| Behaviour | Viewed pricing, added to cart, used feature X | Events | Yes: the clearest signal of intent |
| Lifecycle stage | New, returning, dormant | First and last activity | Yes, for onboarding and win-back |
| Value | Recent, frequent, high-spend (RFM) | Orders and amounts | Yes, for loyalty and retention |
Two guidelines help you choose:
- Start with behaviour, source or lifecycle if you are unsure. You already have the data, and each points to an obvious action.
- Use demographics last. They are cheap to describe but weakly connected to what people do on your site, and most visitors never tell you their age or role anyway.
| Dimension | Example split | Usually actionable? |
|---|---|---|
| Geography | Country, region, language | When prices, shipping or language differ |
| Demographics | Age, role, company size | Only if you hold the data and it changes the offer |
| Acquisition source | Channel, campaign, referrer | Yes, for budget and landing pages |
| Behaviour | Viewed pricing, added to cart | Yes: the clearest signal of intent |
| Lifecycle stage | New, returning, dormant | Yes, for onboarding and win-back |
| Value | Recent, frequent, high-spend (RFM) | Yes, for loyalty and retention |
Start with behaviour, source or lifecycle if you are unsure; use demographics last.
How do you segment an audience, step by step?
- Write the decision first. "I want to raise checkout conversion" or "I want to bring back customers who stopped buying". A segmentation with no decision behind it ends up as a report nobody opens.
- Pick one dimension from the table. Not three. Combining dimensions multiplies the groups and cuts each group's size.
- Define the rule precisely, with a time window: "viewed the pricing page in the last 30 days", not "interested in pricing".
- Count the group. If it holds fewer people than you could act on, widen the window or merge groups. A group of 40 cannot support a test.
- Compare the groups on the number that matters for your decision (conversion, repeat rate, revenue per person). This is the validation step, covered next.
- Attach one action to each group that differs, and drop any split that gets the same action as another.
- Review quarterly. People move between groups and rules go stale.
How do you check that segments really behave differently?
A split can look different just by chance. Before building on it, run a two-proportion test on the rate you care about. For large samples, NIST's engineering handbook gives the z statistic for comparing two proportions (source):
z = (p₁ − p₂) ÷ √( p̂ × (1 − p̂) × (1/n₁ + 1/n₂) ), where p̂ = (x₁ + x₂) ÷ (n₁ + n₂)
Here x is the number who converted and n the group size. As a working rule, |z| above about 1.96 means the gap is unlikely to be chance at the usual 5% level; |z| below that means treat the groups as the same.
That tests whether the difference is real, not whether it is large enough to matter. Also look at the size of the gap and the size of the group: a real 0.1-point difference in a small group is not worth a separate treatment.
Worked example: four splits of the same 10,000 visitors
Sample data: 10,000 visitors in a month produced 462 orders, an overall conversion rate of 4.62%. A team tries four splits.
| Split | Group A | Group B | Rates | z | Verdict |
|---|---|---|---|---|---|
| Device | Mobile 5,000 / 226 orders | Desktop 5,000 / 236 | 4.52% vs 4.72% | −0.48 | No difference |
| Country | US 6,500 / 300 | Other 3,500 / 162 | 4.62% vs 4.63% | −0.03 | No difference |
| Visit type | New 3,000 / 60 | Returning 7,000 / 402 | 2.00% vs 5.74% | −8.17 | Clear difference |
| Viewed pricing | Yes 1,800 / 216 | No 8,200 / 246 | 12.00% vs 3.00% | 16.47 | Clear difference |
Take the last row through the formula: p̂ = (216 + 246) ÷ 10,000 = 0.0462. Then 0.0462 × 0.9538 = 0.04407, and 1/1,800 + 1/8,200 = 0.000678. Their product is 0.0000299 and its square root is 0.00546, so z = (0.12 − 0.03) ÷ 0.00546 = 16.5, the 16.47 in the table before rounding.
What this tells the team:
- Device and country are not worth a separate treatment for conversion. The groups convert at the same rate, and splitting them would create work with no different action.
- New versus returning visitors differ, but the "returning" group is the larger one, so the question is what new visitors need.
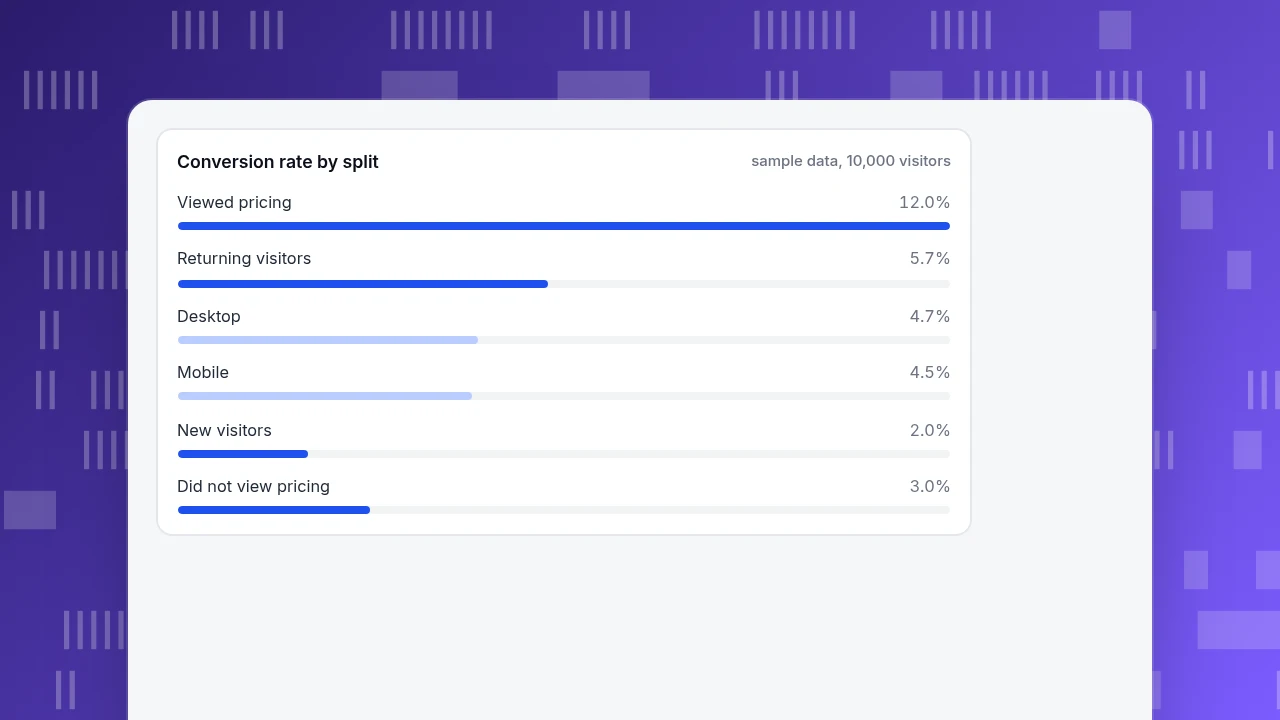
- "Viewed pricing" is the strongest split: 18% of visitors, 47% of orders (216 ÷ 462), and a 12.0% rate against 3.0%. It also points to an action, for example inviting the group to chat after some time on the pricing page.
One caution: the pricing group converts well partly because people who look at pricing were already close to buying. The test shows the groups differ, not that the pricing page causes the difference. Test the action on the group before assuming it will lift conversion.
Conversion rate by split
sample data, 10,000 visitorsHow many segments should you have?
As few as your actions require. A practical rule: one segment per distinct action, and no more than you can maintain.
- Start with 3 to 5. For example: new visitors, visitors who viewed pricing, customers, dormant customers.
- Merge segments that get the same action. Two groups that both receive the same message are one group.
- Make groups big enough to act on. A useful floor is a group that, with a realistic lift, would change your result: in the example, a 2-point lift on the 1,800 pricing viewers is 36 more orders a month.
- Do not overlap needlessly. Overlap is fine (a person can be both "new" and "viewed pricing"), but decide which action wins if two apply.
If you need examples of segments that other teams use, see user segmentation examples, and for the analysis side customer segmentation analysis.
What mistakes do people make when segmenting?
- Segmenting without a decision. The groups get named and never used.
- Trusting a visible difference. In the example, device looked slightly different (4.52% vs 4.72%) and was not.
- Too many dimensions at once. Four dimensions with three values each make 81 groups; most will be too small to read.
- Demographics you do not hold. If most visitors never give their age, the segment is built on a minority.
- Static segments that go stale. A list built once in January describes January's visitors.
- Confusing correlation with cause. A segment that converts well is not proof that what you show it works.
- No review. Check the rules each quarter; products, channels and people change.
How do you segment your audience in TapCub?
Here is how the team in the example would set up the "viewed pricing" split in TapCub. TapCub builds and analyses the segments; it does not send campaigns to them.
- Create the segment. In All-platform analytics › Users › Segments & tags, create a segment. A Live segment can use "visited a page" and joins people at collection time, with no daily rebuild; a Rule segment (did or did not do something, property, first seen, active, sequence, tag) refreshes every day or on demand. Preview the count, then save.
- Compare it with everyone else. Click Analyze to apply the segment as a cohort in an analysis, and compare its conversion with the all-visitors figure from All-platform analytics › Behavior › Behavior analysis. Check the z test above outside TapCub; TapCub does not run significance tests for you.
- Use the value dimension. An RFM segment scores people into 10 buckets (champions, loyal, potential loyalists, new, promising, needing attention, about to sleep, at risk, cannot lose, hibernating) from a transaction event and an amount, and records moves between buckets.
- Act on it. The segment size has a 30-day trend, and View users opens the people in it. If a webhook is configured, TapCub emits a membership change, which you can send to your own email or messaging tool. TapCub itself does not do email marketing.
Mind the boundary: anonymous visitors have no profile, so they are never segment members. To segment people rather than devices, identify them with tapcub.login after sign-in; otherwise, choose the analysis identity (visitor, device, person, account) that fits your question.
FAQ
How do I segment my audience?
Write the decision first, pick one dimension (source, behaviour, lifecycle stage, value, geography or demographics), define the rule with a time window, count the group, then compare groups on the metric you care about. Keep a split only if the groups really differ and you would do something different for each.
What are the main ways to segment an audience?
Six cover most uses: geography, demographics, acquisition source, behaviour, lifecycle stage and value (recency, frequency, spend). Behaviour, source and lifecycle usually give the clearest actions because you already hold the data; demographics are weakest when people rarely supply them.
How many segments should I have?
As many as you have distinct actions, and few enough to maintain. Three to five is a reasonable start. Merge segments that receive the same message and drop any that are too small to change your result. More segments rarely help if each one needs its own content.
How do I know if a segment is worth using?
It must be measurable, large enough to matter, different from the others on the number you care about, and linked to an action. Test the difference with a two-proportion test: in the sample, device gave z = −0.48 (no difference) while viewed-pricing gave z = 16.47.
What is the difference between audience segmentation and customer segmentation?
Audience segmentation covers anyone you reach, including anonymous visitors and prospects. Customer segmentation covers people who have bought or signed up. The method is the same; the data differs, since customer segments can use orders and spend, while audience segments rely on source and on-site behaviour.
Sources
- Wendell R. Smith. Product Differentiation and Market Segmentation as Alternative Marketing Strategies. Journal of Marketing 21(1), 1956, pp. 3–8. Verified 2026-11-19.
- NIST/SEMATECH. e-Handbook of Statistical Methods, 7.3.3: How can we determine whether two processes produce the same proportion of defectives?, the two-proportion z statistic with a pooled proportion. Verified 2026-11-19.
Was this article helpful?
We use your answers to fix and expand this page.
Couldn’t send. Please try again in a minute.
Thanks for the feedback. We’ll use it to improve this page.You’ve already sent feedback on this page. Thanks.

Product Adoption Consultant
Explores customer onboarding, live conversations, and self-service, turning common usage questions into practical guidance and improvements.