Try it on your own data
Every report in this article is in the free plan. One snippet for web and apps, up to 10 sites.
Start freeThe impact of poor data quality lands in three places: decisions (a wrong number leads to a wrong choice), cost (people spend time finding and fixing errors) and trust (people stop believing the dashboard). The decision cost is the largest and the hardest to see. In the sample below, a quarter of paid clicks losing their tags made ads look 33% costlier and nearly cut $9,600 of monthly revenue.
What you will learn
- Poor data hurts decisions, cost and trust; decisions cost most and show least, because a wrong number looks like a right one
- In the sample, lost UTM tags made paid ROAS read 2.00 instead of 2.67 and failed a 2.5 rule the real figure passed
- Size your own problem in money per month: error share × the decision it feeds, plus rework hours
What is the impact of poor data quality?
Poor data quality is data that is inaccurate, incomplete, duplicated, late or inconsistent. Its impact shows up in three places, and the order matters because the first is the one people notice last:
| Area | How it shows up | What to measure |
|---|---|---|
| Decisions | A wrong number leads to a wrong choice: budget cut from a channel that works, a fix aimed at the wrong page | Decisions made on a metric × the size of the error |
| Cost | People spend time finding, fixing and re-explaining data; teams re-run reports | Hours of rework × hourly cost |
| Trust | People stop believing dashboards and fall back on opinion or private spreadsheets | How often a number is disputed; how many versions of a metric exist |
Decisions are the most expensive and the hardest to see, because a wrong number looks exactly like a right one. This guide shows how to put a figure on each of the three, using a small online store as the sample. For what data quality means in general and its dimensions, see data quality.
| Area | How it shows up | What to measure |
|---|---|---|
| Decisions | A wrong number leads to a wrong choice, such as a budget cut from a channel that works | The amount a decision moves × the size of the error |
| Cost | People spend time finding, fixing and re-explaining data | Hours of rework × hourly cost |
| Trust | People fall back on opinion or private spreadsheets | How many metrics have more than one number in circulation |
Industry figures give scale only; measure your own.
How large are the costs reported at industry level?
You will meet two large figures, and both are better read as scale than as a forecast for your company.
- Thomas Redman's Harvard Business Review article reports IBM's estimate that poor-quality data cost the US economy about $3.1 trillion a year in 2016, and builds the idea of the hidden data factory: the extra work done in every department to find and correct errors and handle their downstream effects (source).
- Gartner's data-quality page cites research from 2020 that puts the average cost of poor data quality at $12.9 million a year per organisation (source).
Both are headline estimates, not measurements of any one company, and the second is an average across organisations of very different sizes. What they tell you is the shape of the problem: most of the cost is in hidden work and downstream mistakes, not in a visible line item. That is why you have to measure your own.
How does a wrong number change a decision?
Sample data: an online store has three silent data problems in one month. The numbers are recalculated below.
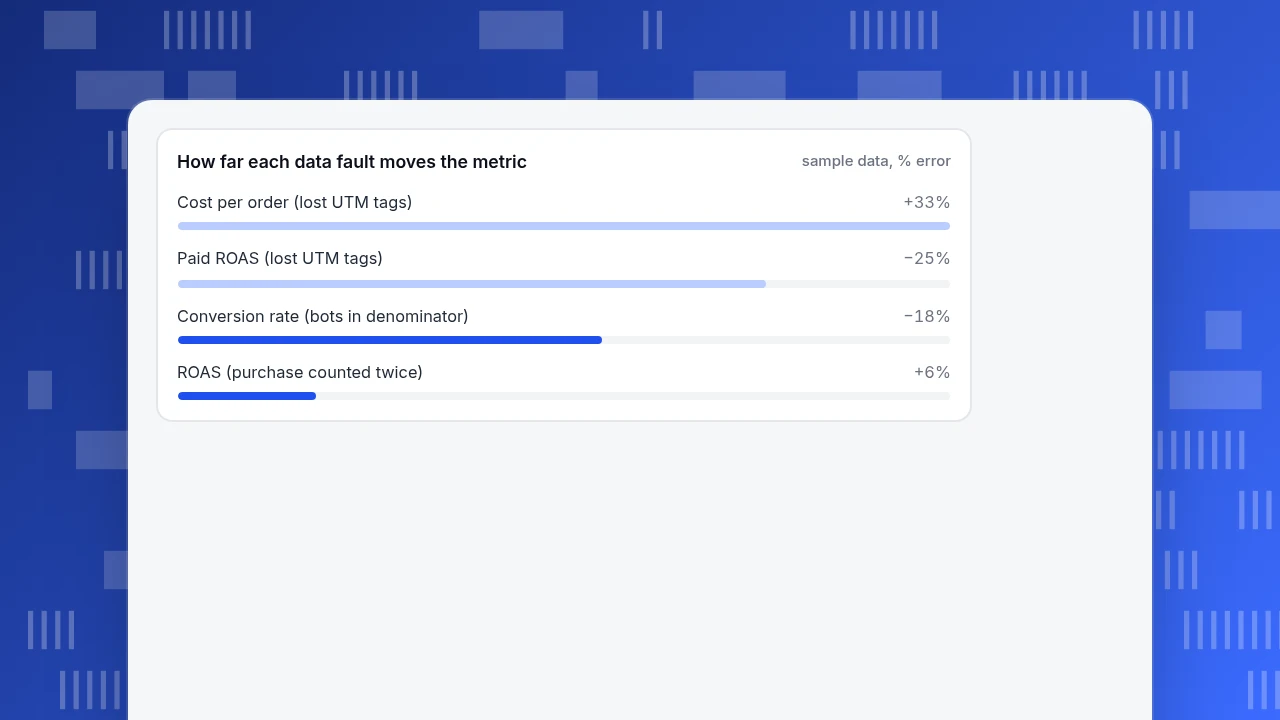
Problem 1: bots in the denominator. The tool records 100,000 sessions, of which 18,000 are bots that nobody filtered. Orders are 1,476, all from people.
- Recorded conversion rate: 1,476 ÷ 100,000 = 1.48%.
- Real conversion rate: 1,476 ÷ 82,000 people = 1.80%.
- The recorded rate is 18% too low. A team that sees "conversion is 1.48%" may launch a checkout redesign that is aimed at a gap that does not exist.
Problem 2: a purchase counted twice. The confirmation page fires the purchase event again when someone reloads it, on 6% of orders. Real orders: 1,500 at an $80 average order, ad spend $30,000.
- Real revenue: 1,500 × $80 = $120,000, return on ad spend (ROAS) 4.00.
- Recorded orders: 1,500 × 1.06 = 1,590, revenue $127,200, ROAS 4.24.
- The campaign looks 6% better than it is. The error is small, and it flatters every channel by the same percentage, so rankings do not change; but a target of 4.0 now looks comfortably beaten.
Problem 3: campaign links without tracking tags. Paid ads spent $18,000 and brought 600 orders at $80, but a quarter of the paid clicks lost their UTM tags and were recorded as direct traffic.
- Real: 600 orders, revenue $48,000, ROAS 2.67, cost per order $18,000 ÷ 600 = $30.00.
- Recorded for paid: 450 orders, revenue $36,000, ROAS 2.00, cost per order $18,000 ÷ 450 = $40.00.
- Paid looks 33% more expensive per order and 25% lower on ROAS than it is.
If the team's rule is "cut a channel below ROAS 2.5", the recorded figure fails and the real one passes. Cut paid by 20% ($3,600 a month) and you forgo $3,600 × 2.67 = $9,600 of revenue a month, caused by a missing tag.
How far each data fault moves the metric
sample data, % errorWhat does poor data cost in time and rework?
Redman's hidden data factory is the right picture: people who never appear in a "data quality" budget spend hours doing it anyway. A rough way to price it:
Annual rework cost = hours per week × weeks × hourly cost × people affected
If one analyst spends 5 hours a week reconciling two sources of the same number, at $60 an hour, that is 5 × 52 × $60 = $15,600 a year, from a single person and a single metric. Add the managers who ask "which one is right?" and the engineers who dig into it, and the true figure is higher.
The same arithmetic prices the fix. If a half-day review of tracking tags every quarter (4 hours × 4 × $60 = $960 a year) prevents even one wrong budget cut like the $9,600 above, it has paid for itself ten times over. Compare the cost of prevention with the cost of one wrong decision, not with zero.
How does poor data quality erode trust?
Trust is the slowest cost to appear and the slowest to recover. The pattern is consistent:
- A number turns out to be wrong once, usually in a meeting.
- People start asking for the source before accepting any figure.
- Teams build their own spreadsheets "to be safe", so there are now two or three versions of every metric.
- Decisions return to opinion because the data is no longer an authority.
You can measure trust without a survey. Count how many metrics have more than one number in circulation, how often a meeting spends time on "whose number is right", and how many dashboards nobody opens. If you want one early warning, look for the second spreadsheet: it is evidence that the first source has lost trust.
How do you put a figure on your own data quality problem?
Run a small audit in an afternoon:
- List the five metrics your decisions rely on most (conversion rate, cost per order, revenue, active users, support volume).
- For each, write the decision it feeds and what that decision is worth per month.
- Check the inputs for three common faults: non-human traffic included, events counted twice or not at all, and missing source tags.
- Estimate the error share for each, as in the three problems above (18%, 6%, 25%).
- Multiply: the amount the decision moves × the revenue it would have returned × the chance that the error changes the decision. For the paid cut the error flipped the decision, so the exposure is the $3,600 cut × 2.67 = $9,600 of revenue a month.
- Add rework hours from the formula above.
Keep the unit as money per month. It gives you a number a manager can compare with the cost of a fix. A related technique is data cleaning; here the goal is only to size the problem.
What does lightweight data governance look like?
You do not need a programme to prevent the three problems. Four habits are enough:
- Name an owner for each key metric, someone who answers "why did this change?".
- Write down what you intend to collect, with a required-properties list, so you can compare what arrives against what you meant to send.
- Check data at the door. Count events and missing fields daily or weekly rather than discovering gaps in a quarterly review. Data observability describes this idea.
- Filter non-human traffic and report it separately so that it cannot inflate denominators.
What mistakes make the cost of bad data worse?
- Waiting for a big error. Silent 6% errors cost money for months because nobody triggers an investigation.
- Fixing the dashboard, not the source. A manual adjustment hides the fault and the next person repeats it.
- Quoting an industry figure to your boss. Headline numbers do not persuade; your own $9,600 does.
- Counting only the direct cost. Rework and lost trust do not appear in a line item.
- Assuming a small error is harmless. The 6% duplicate was uniform and changed no ranking, but the 25% tag loss reversed a decision.
- No owner. If everyone can fix it, no one does.
How do you catch these problems in TapCub?
Here is how the store above would use TapCub to find each of the three problems. TapCub shows where data was lost and flags gaps; it does not repair data at the source or remove duplicate events for you.
- Keep bots out of the denominator. New projects count recognised bots separately by default, so they appear only in Web analytics › Bots and do not inflate visitors or conversion. The same page splits AI and agents, all bots and visits, so you can see how large the share is.
- Compare what arrives with what you planned. In All-platform analytics › Data › Tracking plan, record the events you intend to collect, with required properties. Turn on Live verification (24 h) to see hits in 24 hours and the completeness of required properties for each event; low completeness is a warning, not a block. A purchase event whose hits are far above your order count is the signal for Problem 2.
- See where data was lost. All-platform analytics › Data › Data quality lists ingestion warnings and collector rejects by reason, such as domain mismatch, exclusion rule, quota, rate limit, invalid payload and bots. TapCub's documentation describes the failure it targets: a broken tracker makes reports shrink without an error on the chart.
- Get told early. A monitor in All-platform analytics › Operations › Monitors can watch pv, sessions, error rate or a saved custom metric and notify you. A dry run shows how often it would have fired in the past 30 days. It only notifies; it does not change anything.
- Check sources for tags. Web analytics › Sources shows direct traffic by channel and UTM; a sudden rise in direct with a matching fall in paid is the Problem 3 pattern. Fixing the links is up to you.
FAQ
What is the impact of poor data quality?
It lands in three places: decisions (a wrong number leads to a wrong choice), cost (people spend time finding and fixing errors) and trust (people stop believing the data). In the sample store, missing tags made paid ads look 33% costlier per order and nearly triggered a cut worth $9,600 of revenue a month.
How does poor data quality affect decision making?
A wrong figure looks the same as a right one, so decisions are made with confidence on bad inputs. Even small errors matter near a threshold: a recorded ROAS of 2.0 failed a 2.5 rule that the real 2.67 passed. Check the metrics that feed your biggest decisions first.
How much does poor data quality cost?
Industry figures are large: IBM's estimate of $3.1 trillion for the US in 2016 and an average of $12.9 million a year per organisation from Gartner research in 2020. Treat them as scale only. Your own cost is rework hours plus the value of wrong decisions; for one analyst reconciling two sources it can be $15,600 a year.
How do you measure the cost of bad data?
List the metrics your decisions rely on, write what each decision is worth per month, estimate the error share by checking bots, duplicates and missing tags, then multiply. Add rework hours × hourly cost. Express the result as money per month so it can be compared with the cost of a fix.
How can you prevent poor data quality?
Name an owner for each key metric, write down what you intend to collect, check data as it arrives, and keep non-human traffic out of the denominators. Count events and missing fields on a regular schedule so gaps are caught in days, not at the quarterly review.
Sources
- Thomas C. Redman. Bad Data Costs the U.S. $3 Trillion Per Year. Harvard Business Review, 22 September 2016: IBM's estimate and the hidden data factory. Retrieved through search results, 2026-11-19.
- Gartner. Data Quality: Best Practices for Accurate Insights: the $12.9 million average annual cost from 2020 research, as reported on Gartner's topic page. Retrieved through search results, 2026-11-19.
Was this article helpful?
We use your answers to fix and expand this page.
Couldn’t send. Please try again in a minute.
Thanks for the feedback. We’ll use it to improve this page.You’ve already sent feedback on this page. Thanks.

Data Engineer
Writes about event design, data quality, and collection workflows, with verifiable implementation methods for reliable analytics.