Try it on your own data
Every report in this article is in the free plan. One snippet for web and apps, up to 10 sites.
Start freeThe best alternative to Google Analytics depends on the question: a lightweight counter for traffic, product analytics for funnels, self-hosting for ownership, or a unified tool with live chat. Below: Google's documented limits, a need-to-tool matrix, seven tests and a two-week parallel run you can reconcile.
What you will learn
- Name the friction first: retention limited to 14 months for explorations, 1 million events a day to BigQuery, 25 parameters per event, bots excluded invisibly, or data transfers
- Choose a kind of tool by the question, then test it with seven checks and run it beside the old tool for two weeks
- A steady ratio between tools (here 1.110 to 1.134) is a fixed offset; use your order ledger as the truth for purchases
Why people look for a Google Analytics alternative
Most searches for an alternative start with one of five concrete frictions, each of which is documented in Google's own help pages. Naming the friction first tells you what the replacement has to do.
| Friction | The documented number | Matters when |
|---|---|---|
| History for explorations and funnels | Data retention is 2 months or 14 months; 26 to 50 months only on the paid 360 tier. Standard reports are not affected | You compare this year with two years ago in custom reports |
| Raw data export | Standard (free) properties export up to 1 million events a day to BigQuery | A busy site needs every event in a warehouse |
| Event detail | 25 parameters per event; parameter values cut at 100 characters | Rich events with long values |
| Bot filtering | Known bots are excluded automatically; you cannot disable it or see how much was excluded | You need to know what share of traffic was automated |
| Personal data transfers | The EU adequacy decision for the EU-US Data Privacy Framework (10 July 2023) covers US companies that participate in the framework | Your legal team asks where the data goes |
None of these makes Google Analytics wrong. A small site that reads standard reports never meets the first four. The point is to avoid switching for a reason that does not apply to you, and to know which row you are really trying to fix.
Start from the question you need answered
Alternatives fall into a few kinds of tool, and each kind answers a different question well. Pick the kind first; compare products second.
| If your question is | Kind of tool | Good at | What you give up |
|---|---|---|---|
| How many people visited and what did they read? | Lightweight privacy-first counter | One-page dashboard, small script, little configuration | Funnels, identified users, long event detail |
| Where do users drop out and who comes back? | Product analytics (events, funnels, retention) | Event models, cohorts, user timelines | More setup; traffic reports are secondary |
| Can I run it on my own servers? | Self-hosted open-source analytics | Full data ownership | You maintain the servers, upgrades and backups |
| Which campaign paid back? | All-in-one marketing suite | Campaign reports, ad integrations | Cost, complexity, heavier scripts |
| What did bots and crawlers fetch? | Server log analysis | Counts requests that scripts never see | No browser-side behaviour such as scroll or clicks |
| Web, app and live chat in one place | Unified analytics with chat | One script, one visitor ID across analytics and conversations | It is not an ad platform, an A/B testing tool or an email tool |
Two kinds are often combined: a counter or unified tool for daily reading, plus server logs when you need to see crawlers. The last row is where TapCub sits; the closing section says what it does and does not do.
If you need the broader field first, web analytics tools explains the categories and gives a weighted scoring method for a store versus a publisher; this article starts from the Google-specific frictions.
Seven criteria and how to test each one
A feature list is easy to fill in. These tests need a trial account and an hour.
- Counting rules. Ask what a visitor and a session are, and how long a session lasts. Google defines a session as ending after 30 minutes of inactivity by default. Differences here explain most gaps between tools.
- Bots. Find the report that shows automated traffic separately. If there is none, you cannot tell how much of your count is not human. Imperva's 2025 Bad Bot Report put automated traffic at 51% of all web traffic in 2024, so a tool that hides this decision hides a lot.
- Retention of history. Ask for the longest period you can report on at the level you need, such as raw events, not just totals.
- Export. Try to export one day of raw rows. If you can only export charts, your data is in a one-way door.
- Identity. If you have logins, check whether a person is one profile across devices or one new visitor on each.
- Consent and privacy posture. Find out what is collected before consent, whether cookies are used, and how IP addresses are handled. Whether you need a consent banner depends on the configuration and local law, not on the brand.
- Cost shape. Ask what happens to the price at 10 times your traffic and whether an event, a seat or a project is the unit.
Score each 0 to 3 for your site type before looking at prices. A store should weight drop-off and campaign reports; a publisher, privacy and simplicity.
Run both tools for two weeks and reconcile
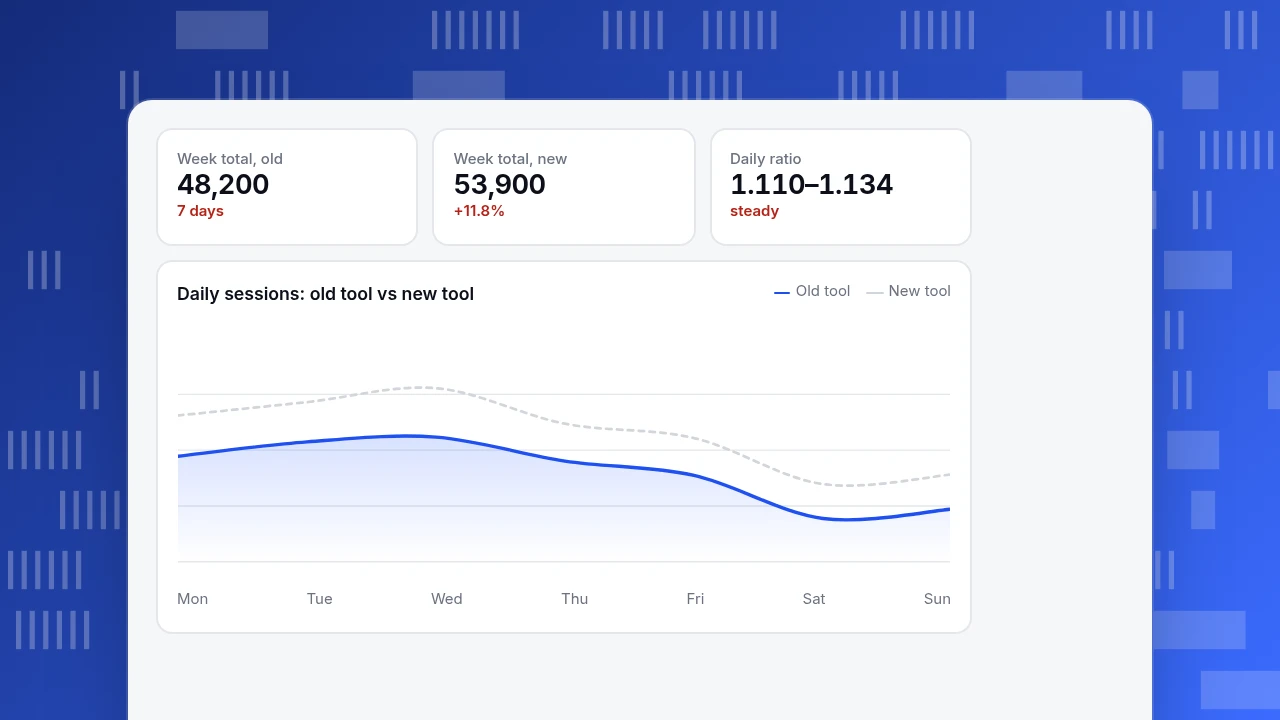
Never switch cold. Install the new tool next to the old one and compare. Sample data: seven days of sessions.
| Day | Old tool | New tool | Ratio |
|---|---|---|---|
| Mon | 7,200 | 8,050 | 1.118 |
| Tue | 7,500 | 8,330 | 1.111 |
| Wed | 7,600 | 8,620 | 1.134 |
| Thu | 7,100 | 7,880 | 1.110 |
| Fri | 6,800 | 7,580 | 1.115 |
| Sat | 5,900 | 6,620 | 1.122 |
| Sun | 6,100 | 6,820 | 1.118 |
| Week | 48,200 | 53,900 | 1.118 |
The new tool counts 11.8% more sessions. That is not an error on its own. What matters is whether the ratio is steady: here it stays between 1.110 and 1.134 all week, a spread of about 0.7% of its mean, so the two tools are measuring the same thing with a fixed offset from definitions, bot handling or visitors who declined consent. If the ratio had swung from 1.02 to 1.30, one tag was failing on some days.
Then check the number that costs money. The shop's order ledger recorded 1,230 orders. The old tool counted 1,205 (−2.0%), a conversion rate of 1,205 ÷ 48,200 = 2.50%. The new tool's conversion rate is 1,230 ÷ 53,900 = 2.28%, lower because it has more sessions in the denominator and because the order count now matches the ledger. So the conversion rate fell 0.22 points with no real change in business.
Three rules follow. Compare the trend, not the level. Take the order ledger, not either tool, as the truth for purchases, and prefer the tool whose conversions land within about 3% of it. And restate old reports using the new tool's definitions from the day you switch, so the dashboard shows a note rather than a mysterious drop.
Week total, old
48,200
7 days
Week total, new
53,900
+11.8%
Daily ratio
1.110–1.134
steady
Daily sessions: old tool vs new tool
Old toolNew tool| Check | Old tool | New tool |
|---|---|---|
| Sessions, 7 days | 48,200 | 53,900 (ratio 1.118) |
| Daily ratio range | — | 1.110 to 1.134 (steady) |
| Orders counted against ledger of 1,230 | 1,205 (−2.0%) | 1,230 (0.0%) |
| Conversion rate | 2.50% | 2.28% |
Sample data. A steady ratio is a fixed offset from definitions, bots or consent; a swinging ratio means a tag failed on some days.
What you lose and keep when you leave
Google's retention setting affects only explorations and funnel reports; standard aggregated reports are not changed by it. That means a switch does not erase old standard reports, but you should export the numbers you will want later before you shut anything off. No tool imports Google Analytics history one for one, because the definitions differ, so plan to keep read access to the old property for year-over-year questions and start the new tool's history fresh.
Before the switch, complete the six steps in order. The full version is in the GA4 migration checklist.
- Write down the 10 reports you open every month and what decision each informs.
- Export those reports as a dated PDF or spreadsheet.
- Install the new tool in parallel for at least two full weeks.
- Reconcile with the ledger as above and accept a fixed offset.
- Move conversion goals and campaign tagging to the new tool and check that UTM parameters carry over; the not set problem is a good test of tagging discipline.
- Keep the old property and its read access.
How TapCub fits, and where it does not
TapCub is the last row of the table above: website, app and mini program analytics, product analytics and live chat from one script. Use the parallel run above and TapCub's own pages in order.
- Install beside the old tool. Take the script from Web analytics › Configuration › SDK code and add it to the site. Use check installation to confirm the first pageview arrived.
- Compare visitors and sessions. Web analytics › Overview shows visitors and sessions. Recognised bots and AI crawlers go to Web analytics › Bots and are not counted in the visitor and conversion numbers, which is one reason counts differ between tools; see are bots counted in visitors.
- Check privacy settings. Configuration › Privacy center holds collection tiers and consent rules per region. Tier 1 is anonymous aggregate counting; the default is tier 2. Whether you need consent depends on the configuration and local law; do I need a consent banner explains the settings.
- Move campaign tagging. UTM parameters and ad click IDs are recorded in Web analytics › Sources; sources and UTM lists the rules.
- Keep the history where it is. TapCub does not import Google Analytics history one for one; see import GA4 historical data.
TapCub does not run A/B tests, send email or run ads, so it will not replace those tools. It measures what happens after the click, in the same project as chat conversations.
FAQ
What is the best alternative to Google Analytics?
There is no single best one; it depends on the question. A lightweight counter suits a simple traffic and content view, product analytics suits funnels and retention, self-hosting suits full data ownership, and a unified tool suits web, app and chat in one place. Test two candidates in parallel with your current tool for two weeks.
Is there a free alternative to Google Analytics?
Yes, several kinds are free in some form: open-source tools you host yourself, free tiers of hosted tools, and server log analysis. The cost shifts to something else, such as server maintenance, a traffic cap or fewer features. Compare the free tier's limits against your traffic and the questions you need answered before you commit.
Why are my numbers different after switching analytics tools?
Different counting rules. Tools differ in how long a session lasts (Google's default is 30 minutes of inactivity), whether bots are counted, and whether visitors who decline consent are visible. A steady ratio between two tools over a week is normal; a ratio that swings means a tag is failing. Use your order ledger as the check for purchases.
Can I import Google Analytics history into another tool?
Not one for one: the definitions differ, so no tool can reproduce old numbers exactly. Keep read access to your old property for year-over-year comparisons and start the new tool's history fresh. Export the reports you rely on before you stop collecting there.
Do I need a cookie consent banner with an alternative?
It depends on what the tool collects, how it is configured and the law where your visitors are, not on the brand. Cookie-free counting with no personal data may avoid a banner in some places; tools with persistent identifiers generally need consent. Check the tool's documentation and ask your legal adviser.
Sources
- Google, Data retention, Analytics Help: 2-month and 14-month options, effect only on explorations and funnels. Checked 2026-11-20.
- Google, BigQuery Export, Analytics Help: 1 million events a day for standard properties. Checked 2026-11-20.
- Google, Collection limits, Known bot traffic and Sessions, Analytics Help: 25 parameters per event; automatic bot exclusion that cannot be disabled; 30-minute session timeout by default. Checked 2026-11-20.
- European Commission, EU-US data transfers: adequacy decision for the Data Privacy Framework, 10 July 2023. Checked 2026-11-20.
- Imperva, 2025 Imperva Bad Bot Report, 15 April 2025: automated traffic was 51% of web traffic in 2024. Checked 2026-11-20.
Was this article helpful?
We use your answers to fix and expand this page.
Couldn’t send. Please try again in a minute.
Thanks for the feedback. We’ll use it to improve this page.You’ve already sent feedback on this page. Thanks.

Data Engineer
Writes about event design, data quality, and collection workflows, with verifiable implementation methods for reliable analytics.