Try it on your own data
Every report in this article is in the free plan. One snippet for web and apps, up to 10 sites.
Start freeFree website analytics is free of a price, not of limits. Five numbers decide whether a free tier works: the monthly event cap, how long data is kept, whether reports are sampled, whether bots are counted as visitors and how many sites, members and platforms are included. Below, five real free tiers are compared on those numbers, and a cap is converted into the sessions it actually covers.
What you will learn
- Compare limits, not prices: caps run from 100,000 to 500,000 events a month, and retention from 7 days of unsampled detail to 14 months
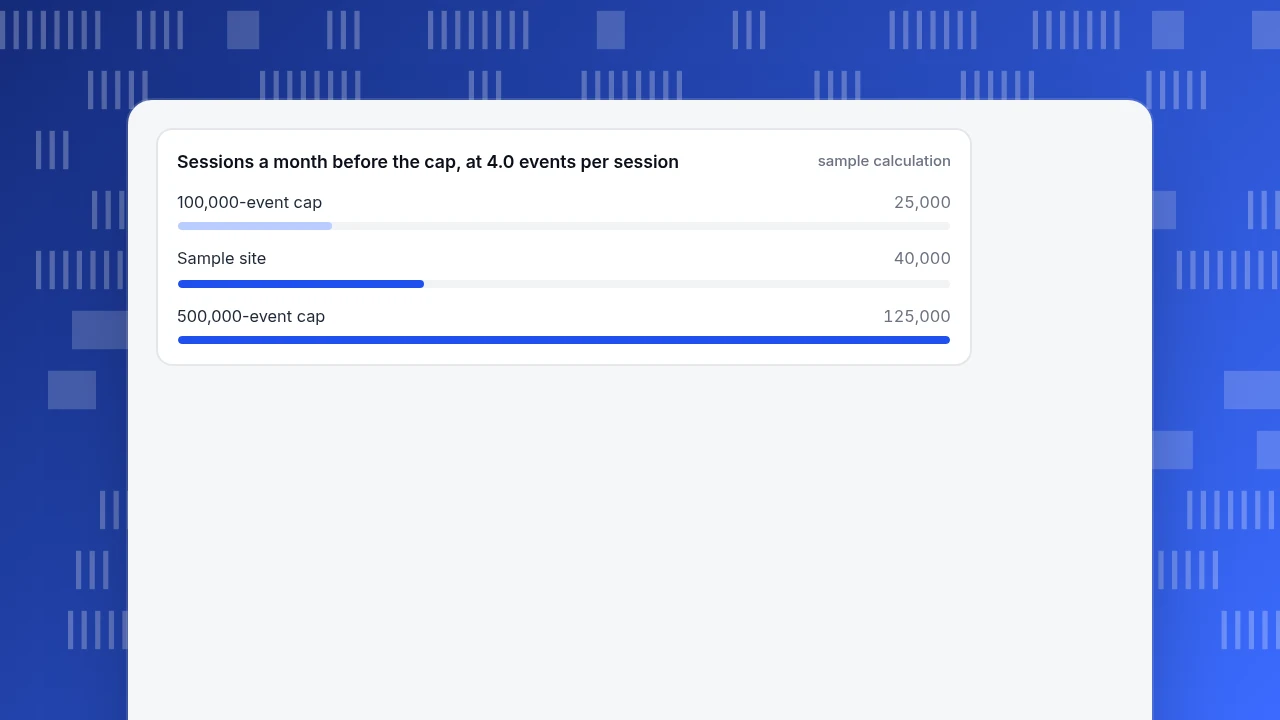
- Convert the cap into sessions: at 4.0 events per session, 100,000 events cover 25,000 sessions and 500,000 cover 125,000
- Check bots and sampling for rare events: a few dozen conversions a month can swing by 30% if automated visits are counted
What do free website analytics tiers actually limit?
Free website analytics is rarely free of limits; it is free of a price. Five limits decide whether a free tier works for you, and each is a number you can check on the provider's public pages before you install anything:
- Volume. How many events or pageviews per month before data stops being stored or the plan stops being free.
- Retention. How long detailed data stays available to query.
- Sampling or aggregation. Whether reports are built from all your data or from a sample or a summary.
- Bots. Whether automated traffic is counted as visitors.
- Scope. How many sites, team members and platforms are included.
The rest of this guide compares real free tiers on those five, shows how to translate a cap into your own traffic, and ends with a decision rule. For a broader tour of products, including paid ones, see web analytics tools; for what the discipline measures, see web analytics.
How do the free tiers compare?
The table uses each provider's own documentation or pricing page, read on 2026-11-20. Where a page says nothing about a limit, the cell says so instead of guessing. Plans change, so check the linked pages before you decide.
| Tool and plan | Volume | Retention | Sampling or aggregation |
|---|---|---|---|
| Google Analytics, standard property | No monthly event cap stated on the limits page; 50 event-scoped custom dimensions | 2 or 14 months, applies to explorations and funnel reports; standard reports unaffected | Explorations sample at 10 million events per query; no unsampled explorations |
| Cloudflare Web Analytics | No volume limit on the product page; soft limit of 10 sites per account | Unsampled data kept 7 days, then aggregated to about 10% of the volume; six months of history | Dashboard queries sampled between 0.0001% and 100%, depending on filters and rows |
| Umami Hobby (hosted) | 100,000 events per month, 1 website | 6 months | Not stated |
| Microsoft Clarity | No traffic limits stated; recordings and heatmaps rather than traffic reports | Recordings 30 days; favorites and a random sample up to 9 months | No sampling stated |
| TapCub Free | 500,000 events per month, 10 sites, web only, 1 member | 182 days (about 6 months) | No report sampling stated (heatmaps and replay have their own sample rates); recognized bots counted separately |
Two observations from the table. First, the volume caps differ by five times between the two tiers that state one (100,000 against 500,000 events), and the tools that state no cap pay for it elsewhere, through sampling or aggregation. Second, nobody's free tier keeps detailed history for more than about 14 months, and several keep six. That matters in the retention section below.
| Situation | Prioritize | Why |
|---|---|---|
| Under 25,000 sessions a month, trend only | Enough retention; a low cap is fine | Caps and sampling rarely bite |
| 40,000 to 120,000 sessions a month | Cap of 500,000 events or none stated | A 100,000-event cap runs out at 4.0 events per session |
| A few dozen conversions a month | Unsampled data and bot filtering | Small numbers swing with sampling and bots |
| Need year-over-year | 13 months or more, or a monthly export | Six months cannot answer it |
| Want to know why people drop | A recordings and heatmaps tool as well | A different job from traffic reporting |
Based on the limits compared above; plans change, so recheck the linked pages.
Will your traffic fit under the cap?
Caps are written in events, but your traffic is in sessions. Convert with one multiplication: events per session = pageviews per session + other events per session. If your tool counts only pageviews and a few tracked actions, and sessions average 2.5 pageviews and 1.5 tracked events, that is 4.0 events per session.
Sample data, at 4.0 events per session:
| Plan cap (events per month) | Sessions per month before the cap | A site with 40,000 sessions uses |
|---|---|---|
| 100,000 | 100,000 ÷ 4.0 = 25,000 | 160,000 events = 160% of the cap |
| 500,000 | 500,000 ÷ 4.0 = 125,000 | 160,000 events = 32% of the cap |
For the same site, one plan runs out in the third week of the month and the other has room to grow to about 125,000 sessions. When you hit a cap, check what the provider does next. In TapCub, for example, collection requests after the cap still return a success status and the event is not stored, the website keeps loading, and the counter resets on the 1st of the month in the site's time zone.
Decision rule: estimate last month's events as sessions × events per session, then pick a plan where that number is under 60% of the cap. The margin absorbs a good month.
Sessions a month before the cap, at 4.0 events per session
sample calculationHow long do you need to keep your data?
Retention decides which comparisons you can make. The one most sites eventually need is this month against the same month last year. That needs at least 13 months of history, because the comparison month has to still be there while the current month is being reported.
| Tool | Keeps detailed data | Year-over-year possible? |
|---|---|---|
| Google Analytics standard (explorations) | Up to 14 months | Yes, narrowly; standard reports are not limited by the setting |
| Cloudflare Web Analytics | Six months of history | No |
| Umami Hobby | 6 months | No |
| TapCub Free | 182 days | No |
If you need year-over-year, you have three options: choose a tier with at least 13 months, export the monthly totals every month into your own spreadsheet (aggregates are enough for trend lines), or accept that your first full year-over-year comparison arrives a year after you start on a six-month tier and you export in the meantime.
How much do sampling and aggregation change the numbers?
A sampled report is built from a subset and scaled up. It is fine for a trend and risky for a rare event. A low-traffic page with 40 conversions can swing a lot when only a fraction of rows is read. Cloudflare's documentation says its queries use a sampling level anywhere between 0.0001% and 100%, and that low-traffic sites are sampled at higher percentages. Google documents that explorations sample at 10 million events per query, which a small site never reaches.
Ask three questions of any tool:
- Is the report built from all rows or a sample, and is there an indicator when it is a sample?
- After the retention window, do you lose the detail or only the detail below a summary level?
- Can you export unsampled data, or only what the screen shows?
Decision rule: if your key number is a rare event (a few dozen sign-ups a month), prefer an unsampled tier or export the raw counts; if it is a traffic trend over thousands of sessions, sampling matters far less.
Are bots in your visitor count?
Bots decide whether your conversion rate is right. Imperva's 2025 Bad Bot Report says automated traffic made up 51% of all web traffic in 2024, with malicious bots at 37%. That is a global figure across the sites Imperva observes, not a measurement of yours, but it is why the question is worth asking.
The effect on your own numbers is simple arithmetic. Sample data: a tool counts 10,000 visits and 400 orders, so it reports a 4.0% conversion rate. If 3,000 of those visits were automated, the real figure is 400 ÷ 7,000 = 5.7%. The tool understated the rate by 30% and would send you looking for a conversion problem that is really a measurement problem.
What to check on a free tier: does it recognize bots and exclude them from visitors and conversion rates, does it list them separately, and does it count them against your event cap? AI crawlers are the newer part of this: some do not run JavaScript and never appear in a script-based tool at all, while others do.
What do free tiers leave out on purpose?
Free tiers are built to leave out the features that cost money to run. Read the scope row of the comparison before you start:
- Platforms. TapCub Free is web only; apps and mini programs start on Pro. Other free tiers are web only or separate products.
- Team access. TapCub Free includes one member per site; Umami's Hobby plan lists no team members.
- Autocapture and identified users. On TapCub Free both are off, so heatmaps and frustration clicks, which depend on autocapture, need Pro.
- Alerts and scheduled reports. On TapCub Free, monitors, alert channels and weekly or monthly email reports are off.
- Different jobs. A recordings and heatmaps tool tells you why people struggle on a page; a web analytics tool tells you how many people came and from where. Using one for the other's job is the usual mismatch.
Decision rule: write down the three questions you need answered every month. A tier that answers them is enough; a feature you will not open in the first quarter should not decide the choice.
Which free option fits which situation?
| Your situation | What to prioritize | Reason |
|---|---|---|
| Small site, under 25,000 sessions a month, traffic trend only | Any tier with enough retention; the lowest cap is fine | The cap and sampling rarely bite |
| 40,000 to 120,000 sessions a month | A cap of at least 500,000 events or no stated cap | At 4.0 events per session a 100,000-event cap runs out |
| Conversions of a few dozen a month | Unsampled data, bot filtering | Sampling and bots move small numbers a lot |
| You need year-over-year | 13 months or more, or a monthly export habit | Six months of history cannot answer it |
| You want to know why people drop | A recordings and heatmaps tool alongside the traffic tool | Different jobs |
How do you check a free tier in TapCub?
Take the 40,000-session site from the volume example. In TapCub the check goes like this:
- Install the snippet and look at the plan. The documentation lists the Free analytics limits as 10 sites, 500,000 events a month and 182 days of retention. The usage page shows how much of the month's quota you have used, and an over-quota notice appears if you pass it.
- Read the traffic. Web analytics › Overview shows visitors, sessions and pageviews for the dates you choose; Web analytics › Sources splits them by channel, referrer and UTM.
- See the bots separately. Web analytics › Bots lists recognized bots and AI crawlers, with the AI and agents, All bots and Visits tabs. New projects default to recognize-and-count-separately, so they stay out of visitor counts and conversion rates. Bots recognized in "separate" mode are still written to the bot table and still pass through the quota check; in "drop" mode a recognized bot does not use the quota.
- Set a goal. Web analytics › Goals counts a page or an event as a conversion and shows conversions, converting visitors and the conversion rate.
- Export before the window closes. Detail older than the retention window is deleted, while daily aggregates such as overview trends are not removed by it. Use All-platform analytics › Data › Data export for raw detail before it ages out.
The free tier has limits you should plan around: Web only, one member per site, and no autocapture, monitors or scheduled reports until Pro.
What mistakes do people make when choosing free analytics?
- Comparing prices instead of limits. Both are free, yet one keeps unsampled detail for 7 days and the other for months.
- Counting pageviews but sizing in sessions. Caps are in events; convert before you compare.
- Forgetting growth. A plan at 90% of its cap in the first month will not survive a good month.
- Ignoring export. A tool without a way to take your data with you turns a free tier into a lock-in.
- Using a behavior tool as a traffic tool. Recordings tell you why; they are not a substitute for knowing how many people arrived and from where.
FAQ
What is the best free website analytics tool?
There is no single answer; it depends on volume, retention and what you need to measure. A suite with no stated event cap fits large sites that can live with sampled explorations; a hosted tier with a hard cap fits small sites; a recordings tool answers a different question. Use the comparison table and your own session count.
Is Google Analytics really free?
Standard Google Analytics properties are free, with limits documented by Google: retention of 2 or 14 months for explorations, 50 event-scoped custom dimensions, and sampling in explorations at 10 million events per query. Paid 360 properties lift these limits. Check the current limits page, because they change.
How many visitors can a free analytics plan handle?
Divide the event cap by your events per session. At 4.0 events per session, a 100,000-event plan covers 25,000 sessions a month and a 500,000-event plan covers 125,000. Count pageviews plus tracked actions, not pageviews alone, and keep usage below about 60% of the cap.
Do free website analytics tools filter bot traffic?
It varies. Some recognize and exclude bots; some do not say. Imperva's 2025 report puts automated traffic at 51% of all web traffic in 2024, so unfiltered counts can understate conversion rates materially. Check whether the tool lists bots separately and whether they count toward your cap.
Can I move from a free plan to a paid one without losing data?
Check each provider's terms, because retention follows the plan. In TapCub, after a plan expires there is a 30-day grace period, after which detailed data older than the lower plan's retention is removed, while aggregated trends remain. Export what you need before any downgrade.
Sources
- Google, Data retention and Analytics limits: standard-property retention (2 or 14 months), custom dimensions and exploration sampling. Checked 2026-11-20.
- Cloudflare, Web Analytics FAQ: 7-day unsampled storage, aggregation, 0.0001% to 100% sampling and the 10-site soft limit; and the Web Analytics product page. Checked 2026-11-20.
- Umami, Pricing: Hobby plan, 100,000 events per month, 1 website, 6 months retention. Checked 2026-11-20.
- Microsoft, Clarity FAQ: no sampling, no traffic limits, 30-day recording retention. Checked 2026-11-20.
- Imperva, 2025 Bad Bot Report: automated traffic 51% of web traffic and malicious bots 37% in 2024. Checked 2026-11-20.
Was this article helpful?
We use your answers to fix and expand this page.
Couldn’t send. Please try again in a minute.
Thanks for the feedback. We’ll use it to improve this page.You’ve already sent feedback on this page. Thanks.

Data Analyst
Explores traffic sources, conversion funnels, and retention, using clear metric definitions and concrete examples to explain what the numbers mean.