Try it on your own data
Every report in this article is in the free plan. One snippet for web and apps, up to 10 sites.
Start freeChoose a funnel analytics tool on three capabilities: flexible step definitions, group splits and a way to drill into who dropped. Every tool draws a shrinking bar chart; the difference is in the counting rules and what you can do after seeing a drop. This guide gives a criteria table, two recomputed examples where the answer changes with the settings, and a 14-day trial plan.
What you will learn
- Compare step definitions, counting rules and drill-down, not the chart; every tool draws the same bars
- Split by group: in the sample, overall conversion fell 1 point while both devices improved
- Write the counting rule beside every funnel number; the same behaviour gave 14.3% to 30.0%
What should a funnel analytics tool let you do?
A funnel analytics tool shows how many people complete an ordered set of steps, where they drop and how long completion takes. Nearly every tool draws bars that shrink from left to right, so the picture is not what separates them. Three capabilities do:
- Flexible step definitions. Can a step be an event, a page, several alternatives or a filtered event, and can you control order and time window?
- Group splits. Can you break the funnel down by device, source or customer group, and compare the groups side by side?
- A way back to the detail. Can you click a step and see who dropped there, not only how many?
These matter because a funnel number is only as honest as its counting rules, and because an overall conversion rate can hide the thing you need to fix. The rest of this guide gives you a checklist for each, two recomputed examples that show how much they change the answer, and a short trial plan. For the concept itself, see the glossary entry on funnel; for the errors that most often distort a funnel, see funnel analysis mistakes.
What should you check when comparing funnel tools?
Use this table in a trial. Each row has a question you can answer with your own data in an afternoon.
| Criterion | Question to ask | Why it matters | How to test it |
|---|---|---|---|
| Step definition | Can a step be an event, a page, a wildcard or a set of alternatives, with filters? | Real journeys do not follow one clean path | Rebuild your checkout with its real variants |
| Order | Can you choose ordered, strict or any order? | The same data gives different rates under each | Run one funnel under all three |
| Counting | Unique people or every attempt? | A repeat visitor can count twice | Compare against your orders table |
| Time window | How long may a person take between the first and last step? | A 1-day window cuts slow buyers | Run 1-day and 7-day versions |
| Group split | Can you break down by device, source, country or a saved group? | Averages hide the group that is failing | Split by device and compare |
| Detail | Can you list people or sessions who dropped at a step? | You need to see why, not only how many | Click the biggest drop |
| Identity | Does it join anonymous visits to logged-in users? | Journeys cross sign-up | Test a funnel that includes login |
| Time between steps | Does it show the median time per step? | Slow steps are a friction signal | Check one step you know is slow |
| Exclusions | Can you drop people who did something between steps? | Removes cancel and refund noise | Add an exclusion event |
| Export | Can you export or query the underlying events? | You will want a number the tool does not show | Request a raw export |
Google Analytics 4's funnel exploration is a documented example of such options: it distinguishes open funnels, where people may enter at any step, from closed funnels, which require entry at the first step; it allows up to 10 steps; it can show elapsed time between steps; and it can break each step down by a dimension such as device category, attributing a person only to the first breakdown value they match. Whatever tool you consider, check that the options exist and read their definitions.
| Criterion | Question to ask | How to test it |
|---|---|---|
| Step definition | Event, page, wildcard, alternatives, filters? | Rebuild your checkout with its real variants |
| Order | Ordered, strict or any order? | Run one funnel under all three |
| Counting | Unique people or every attempt? | Compare against your orders table |
| Time window | How long between first and last step? | Run 1-day and 7-day versions |
| Group split | Break down by device, source, group? | Split by device and compare |
| Detail | List the people who dropped? | Click the biggest drop |
Run the rows in a trial with your own data before you compare pricing.
Why do group splits change the answer? A worked example
Sample data: a store's checkout conversion in two months, with traffic split between desktop and mobile.
| Month 1 | Month 2 | |
|---|---|---|
| Desktop visitors | 4,000 | 2,000 |
| Desktop conversion | 10.0% (400 orders) | 11.0% (220 orders) |
| Mobile visitors | 6,000 | 8,000 |
| Mobile conversion | 2.0% (120 orders) | 2.5% (200 orders) |
| Overall | 520 ÷ 10,000 = 5.2% | 420 ÷ 10,000 = 4.2% |
Overall conversion fell by a full point (5.2% to 4.2%), and a funnel that shows only the total says "something broke". Yet both devices improved: desktop from 10.0% to 11.0%, mobile from 2.0% to 2.5%. What changed is the mix: mobile, the lower-converting group, grew from 60% to 80% of visitors. This reversal of a trend when groups are combined is Simpson's paradox, described in the Stanford Encyclopedia of Philosophy.
A tool that cannot split the funnel by device would have sent you looking for a bug that does not exist. One that can would show you the real question: why does mobile convert at about a quarter of desktop's rate? That is the funnel to work on.
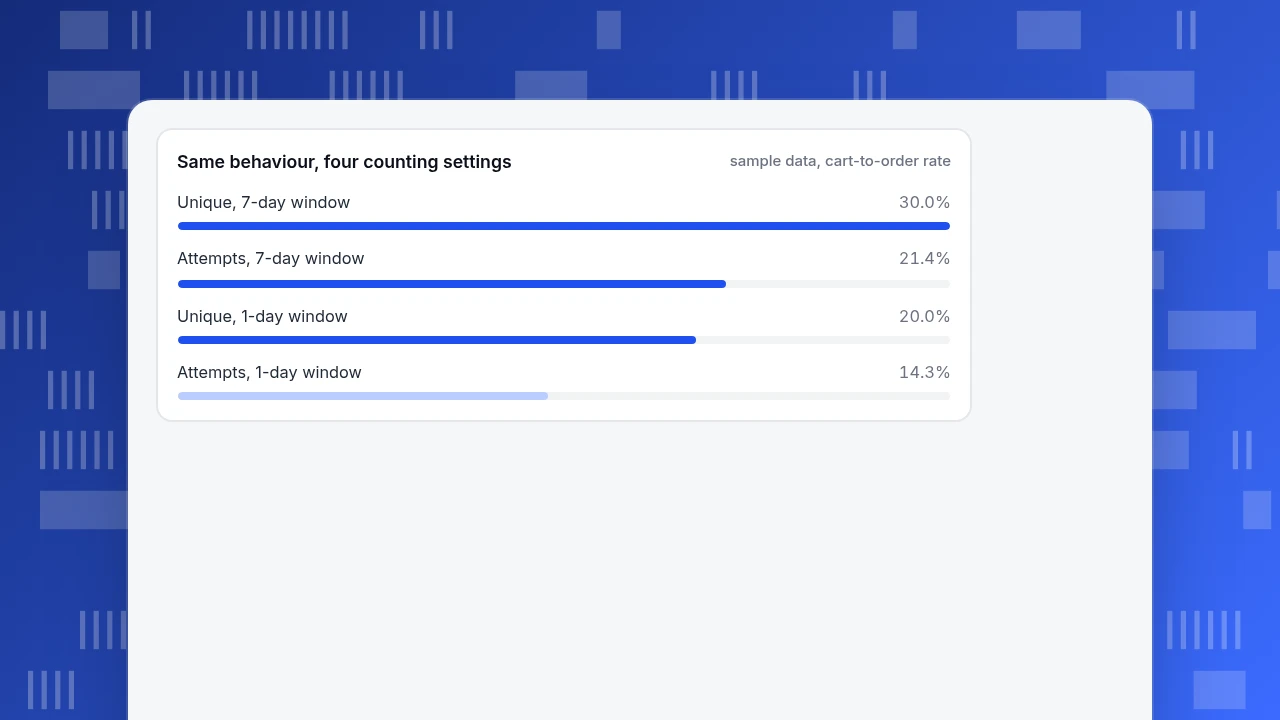
Same behaviour, four counting settings
sample data, cart-to-order rateWhy do counting rules change the number?
Sample data: 1,000 visitors, a three-step funnel (view product, add to cart, order). 300 people added to cart; between them they made 420 add-to-cart entries because some came back. 90 people ordered, 60 of them within one day of their first add-to-cart.
| Setting | Calculation | Cart-to-order rate |
|---|---|---|
| Unique people, 7-day window | 90 ÷ 300 | 30.0% |
| Unique people, 1-day window | 60 ÷ 300 | 20.0% |
| Every attempt, 7-day window | 90 ÷ 420 | 21.4% |
| Every attempt, 1-day window | 60 ÷ 420 | 14.3% |
The same behaviour produces rates from 14.3% to 30.0%, depending on two settings. Neither is wrong, but they answer different questions: "what share of people finish?" versus "what share of attempts end in an order?". The trap is comparing two numbers produced with different settings, or a tool's number with your finance report. Write down the counting rule next to every funnel figure.
How do you run a 14-day trial of a funnel tool?
A short, structured trial beats a long demo:
- Days 1 to 2: define one real funnel from your own data, with the steps and window you would use in practice.
- Days 3 to 4: reconcile. Compare the final step with a number you trust (your orders table). If they differ by more than a few per cent, find out why before going on: identity, duplicates or time zone.
- Days 5 to 8: test the criteria in the table, especially order, counting, window and group split. Record what each setting does to the rate.
- Days 9 to 10: drill. Click the biggest drop and see whether you can reach the people or sessions behind it.
- Days 11 to 12: test a hard case, such as a funnel that crosses login or has two alternative paths.
- Days 13 to 14: score. Weigh the criteria for your situation, for example step flexibility 30%, group split 25%, drill 20%, reconciliation 15% and export 10%, and rate each option out of 5.
Pricing, data location and privacy should be on the checklist too, but decide them after the analytical tests, not before.
What are the most common mistakes when choosing a funnel tool?
- Choosing on the chart. Every tool draws a funnel; compare the counting rules.
- Not reconciling. If the last step does not match your orders, the rest is decoration.
- Reading only the total. Overall rates can reverse when groups change.
- Mixing settings. A 7-day unique rate and a 1-day attempts rate are different quantities.
- Ignoring identity. Journeys that cross login get double-counted or cut in half.
- No way to see people. A drop you cannot investigate can only be guessed at.
- Testing with a toy funnel. Use a real, messy journey in the trial.
How does TapCub handle funnels?
Here is what TapCub's funnel does against the criteria above, including its limits. A funnel is built in All-platform analytics › Behavior › Behavior analysis:
- Step definition. Between 2 and 20 steps; each step is event names (several names act as OR) or page paths with wildcards, and each can have its own filters. Events are picked from a searchable list by category.
- Rules. Order is ordered (other events may sit between steps), strict (no other funnel-step event between two steps) or any order. Counting is unique by default (first entry per subject per session, then distinct subjects) or attempts (every session entry). The window defaults to 7 days and goes up to 180. Steps can be required to share a session, up to 5 exclusion events drop a conversion if they occur between steps, and a hold property requires the same value on every step.
- Groups. Breakdown uses the first layer only and keeps the 10 groups with the most entries; saved segments, filters and the identity (person by default) are set in the measurement model. There is no compare-period option.
- Detail. Each step shows count, rate against step one and the previous step, drop-off and the median time from the previous step. The largest drop is marked. Click a step to see the people who arrived or dropped there, and from a person open their timeline in All-platform analytics › Users › People.
- Neighbours. Funnel, goal and path answer different questions (see help: funnel vs goal vs path); for step-by-step setup see build a funnel. Where you need a number the page does not show, All-platform analytics › Behavior › Metrics & SQL queries the event data.
- Know the limits. TapCub has no compare period in the funnel, the breakdown covers one layer, timing uses at most 20,000 completed samples, and people who never finish are absent from the time distribution. It measures the funnel; it does not run experiments to improve it.
FAQ
What is a funnel analytics tool?
Software that shows how many people complete an ordered set of steps, such as sign-up or checkout, where they drop and how long completion takes. The useful ones also split by group and let you drill to the people who dropped.
What features should a funnel analysis tool have?
Flexible step definitions (events, pages, alternatives, filters), control over order, counting and time window, breakdown by group, drill-down to people or sessions, median time per step, identity across login and export of raw data.
How do you choose a funnel analytics tool?
Rebuild one real funnel in a trial, reconcile its last step with a number you trust, test order, counting, window and group split, and check you can reach the people who dropped. Score the options against weights that reflect your situation.
What is the difference between a funnel and a goal?
A funnel is an ordered sequence of steps with drop-off between them; a goal counts one event or page as a conversion. Use a funnel to find where people leave and a goal to count the outcome.
Why does my funnel conversion rate change with the settings?
Because counting unique people versus attempts and the length of the time window change both numerator and denominator. In the example above the same behaviour gave rates from 14.3% to 30.0%. Always record the settings beside the number.
See also: Product Analytics Tools: What to Compare Before You Pick One.
See also: Funnel Analysis: How to Build, Read and Fix a Funnel.
Sources
- Google Analytics Help. Funnel exploration. Open and closed funnels, step limit, elapsed time and breakdown.
- Stanford Encyclopedia of Philosophy. Simpson's Paradox. Trends that reverse when groups are combined.
Was this article helpful?
We use your answers to fix and expand this page.
Couldn’t send. Please try again in a minute.
Thanks for the feedback. We’ll use it to improve this page.You’ve already sent feedback on this page. Thanks.

Data Analyst
Explores traffic sources, conversion funnels, and retention, using clear metric definitions and concrete examples to explain what the numbers mean.