Try it on your own data
Every report in this article is in the free plan. One snippet for web and apps, up to 10 sites.
Start freeFunnel analysis measures how many people complete an ordered series of steps and where they leave. This guide covers how to build a funnel with honest numbers, how to read drop-off, which step to fix first, and how to compare segments, with a sample you can recompute.
What you will learn
- Build a funnel from one goal, measurable steps, an order rule, a time window and a clear definition of who counts.
- The biggest drop is not always the best step to fix: weigh people lost, how close they were to converting, and whether the cause is fixable.
- Split the funnel by one property, such as device, before acting: an overall average can hide a problem that exists in only one group.
What is funnel analysis?
Funnel analysis is a method for measuring how many people complete an ordered series of steps, such as view a product, add to cart, check out and pay, and finding the step where most of them leave. You count who reached each step, divide by the step before, and the weak step shows up as a drop in the numbers. It turns a vague worry ("conversion is low") into a specific question ("why do people leave between checkout and payment?").
This guide is the hub for funnel analysis on this site. It covers how to build a funnel that gives honest numbers (steps, order, time window, same-session or cross-session), how to read the drop-off, how to decide which step to fix first, why segment comparison matters, and the mistakes that quietly ruin results. There is a sample-data example you can recompute, and a short section on doing it in TapCub.
How do you build a funnel step by step?
Build a funnel by writing down the journey, turning each stage into something you can measure, and fixing the rules that decide who counts as converted. Six decisions matter, and the table below lists the technical ones.
- Pick one goal. A funnel answers one question about one journey: sign-up to activation, product view to purchase, landing page to demo request. A funnel with two goals is two funnels.
- Choose the steps. Use the actions people must take, not every page they could see. Most useful funnels have 3 to 7 steps. Google's funnel exploration report allows up to 10 steps, which hints that more than that is rarely readable.
- Make each step measurable. A step is a page view or an event. If the event does not exist yet, you cannot see the step, so list the events you need before you build the chart.
- Decide the order rule. Does the step order have to be followed exactly, or may people do other things in between, or take the steps in any order?
- Set the time window. How long does someone have, from step one, to finish?
- Decide who counts. One entry per person, or every attempt? Within one session, or across sessions?
| Decision | Options you will meet | Rule of thumb |
|---|---|---|
| Order | Ordered (other actions allowed between steps), strict (nothing else between), any order | Start with ordered; use strict only when the sequence is enforced, such as a checkout wizard |
| Window | Minutes, hours or days from step one | Match the real buying or sign-up cycle: minutes for a checkout, days for a trial |
| Counting | Unique (first entry per person), total (re-entries count), per session | Unique for a conversion rate; per session when sessions are your unit |
| Session scope | Same session or across sessions | Same session for a checkout; across sessions for anything people think about overnight |
| Entry | Open (people may join at any step) or closed (must start at step one) | Closed for a conversion rate; open only for diagnosis |
Products name these options differently. Mixpanel's advanced funnel docs describe a default 7-day conversion window (up to 366 days), "specific order" or "any order", and counting by uniques, totals or sessions. Google calls the entry rule open or closed. The vocabulary changes, the decisions do not.
How should you set the order and the time window?
Set the window from the real behaviour of your customers, not from a default, and say which kind of order your funnel enforces. These two settings change the headline number more than any design tweak, and they are the usual reason two people measuring the "same" funnel get different answers.
Time window. A short window undercounts journeys that naturally take longer. Someone who adds a jacket to the cart on Monday and buys on Thursday is a conversion in a 7-day window and a loss in a 1-hour window. Mixpanel's default of 7 days is a reasonable starting point for a considered purchase; a pure checkout can use minutes or hours. If you compare funnels, give them the same window, or the comparison measures the window rather than the journey.
Same session or across sessions. A same-session rule asks "did they finish in one visit", which suits checkout and short forms. A cross-session rule asks "did they ever finish", which suits sign-up to paid, B2B evaluation, and anything with a night's sleep in the middle. Across sessions needs a visitor ID that survives between visits; a privacy setting that rotates the ID daily makes day-two returns look like new people.
Order. Strict looks cleaner and fails sooner: a visitor who opens a help page between cart and checkout drops out of a strict funnel without having abandoned anything. Choose it only for a truly fixed sequence.
How do you read where people drop off?
Read each step on three numbers: how many entered, the rate from the previous step, and the rate from step one. The previous-step rate shows where a step leaks. The step-one rate shows what a step is worth to the whole journey. Look at both.
Check three things before concluding anything:
- Is the step real? A suspiciously low rate often means a tracking gap: the event fires on one device or one checkout path but not another. Compare to a source you trust, such as orders in your shop admin.
- How long do people take? Median time between steps matters as much as the rate. A step that converts well but takes two days points to an email or approval delay rather than a product problem. Use the median, not the mean, which one stray session can drag.
- Who is dropping? The count alone does not say. Open the people at the drop, or compare segments (below).
Baymard Institute gives context for checkout drop-off. Its cart abandonment page reports an average documented abandonment rate of 70.22%, the mean of 50 studies published from 2006 to 2025, and its survey of US shoppers lists extra costs (40%), slow delivery (20%), distrust with card details (19%), forced account creation (18%) and a long or complicated checkout (17%) among the reasons. It is a general average from other shops; use it as context, not a target. For a full reading guide, see read funnel drop-off, and for the definition, funnel.
Which step should you fix first?
The biggest drop is not always the best place to work. Choose the step where the number of recoverable people, the likelihood you can recover them, and the effort needed combine best. Three questions sort the candidates:
- How many people could you win back? Count people lost, not the percentage. Losing 7,600 people at the top of a funnel looks worse than losing 240 at the end.
- How close were they to converting? Someone who has typed a card number is nearer to paying than someone who opened a product page. The same number of recovered people near the end is worth more, and it is usually easier to find a reason.
- Is the cause fixable? A drop between landing page and product view may be an audience problem, not a page problem. A drop on the payment step often has a concrete, fixable reason: an error, a missing payment method, a surprise fee.
The sample below shows why this matters: the top step loses the most people, yet the late step is the better first project. Then fix one thing at a time and read the same funnel again over the same window; two changes at once teach you nothing. For a wider playbook, see conversion funnel optimization.
Why compare segments instead of one overall funnel?
An overall funnel is an average, and averages hide the groups that behave differently. Splitting every step by one property (device, source, country, new versus returning) is the fastest way to turn "people drop here" into "this group drops here, so look at this". It is also where the best leads come from: a mobile checkout bug, a campaign that brings the wrong audience, a country whose payment method is missing.
Split by one property at a time, keep each group large enough to read (a 40% rate from 20 people moves several points when one person converts), and use the same window and steps in every group. Mixpanel's funnel guide describes the same idea as breaking a funnel down by properties such as platform to see which segments convert differently.
What mistakes break funnel analysis?
Most bad funnels fail in the setup, not the analysis. The usual causes:
- Steps that do not match how people really move, for example a strict order for a journey with detours.
- A window that is too short, so slow converters count as losses.
- Reading a small segment, or a short date range, as a trend.
- Treating bots as visitors, which inflates the top of the funnel and pushes every rate down.
- Changing the funnel definition and comparing with the past, which compares two different measures.
- Assuming a drop explains itself. The funnel says where, never why; you need sessions, support chats or interviews for why.
The full list, with examples and fixes, is in funnel analysis mistakes.
How does a funnel work with real numbers?
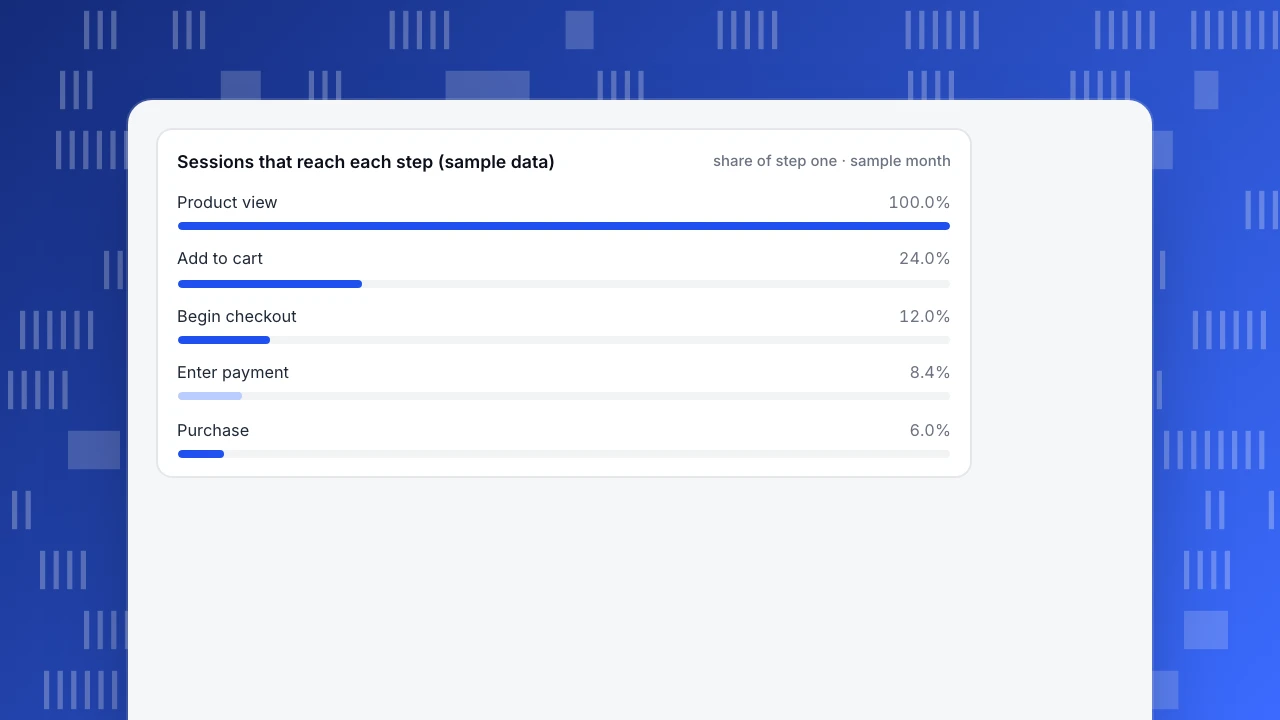
Sample data, invented for illustration and recomputed here: a shop with 10,000 sessions that viewed a product page in 30 days, measured in sessions with a 7-day window.
| Step | Sessions | From previous step | From step one | Lost at step |
|---|---|---|---|---|
| Product view | 10,000 | n/a | 100.0% | n/a |
| Add to cart | 2,400 | 24.0% | 24.0% | 7,600 |
| Begin checkout | 1,200 | 50.0% | 12.0% | 1,200 |
| Enter payment | 840 | 70.0% | 8.4% | 360 |
| Purchase | 600 | 71.4% | 6.0% | 240 |
Check the arithmetic: 2,400 ÷ 10,000 = 24.0%; 1,200 ÷ 2,400 = 50.0%; 840 ÷ 1,200 = 70.0%; 600 ÷ 840 = 71.4%; overall 600 ÷ 10,000 = 6.0%.
Top versus bottom. Add to cart loses the most sessions (7,600), but that is where browsing and window-shopping live, so it is hard to know what to fix. Of the 840 sessions that reached payment, 240 left: people who already chose a product and started to pay, the group most likely to respond to a fix.
Segments change the answer. Split the same funnel by device:
| Device | Sessions | Add to cart | Begin checkout | Enter payment | Purchase | Payment to purchase |
|---|---|---|---|---|---|---|
| Desktop | 4,000 | 1,200 | 600 | 420 | 360 | 85.7% |
| Mobile | 6,000 | 1,200 | 600 | 420 | 240 | 57.1% |
| Total | 10,000 | 2,400 | 1,200 | 840 | 600 | 71.4% |
The totals reconcile (4,000 + 6,000 = 10,000; 360 + 240 = 600), and the 71.4% at the bottom is an average of 85.7% on desktop and 57.1% on mobile. Overall conversion is 9.0% on desktop (360 ÷ 4,000) and 4.0% on mobile (240 ÷ 6,000). The payment step is not weak everywhere; it is weak on mobile, so check mobile card entry, wallet options and field errors before touching anything else.
What a fix is worth. If mobile payment-to-purchase rose from 57.1% to 80% (336 of 420), purchases would rise by 96 to 696, an increase of 16.0%. Raising add to cart from 24.0% to 26.0% would give 2,600 × 50.0% × 70.0% × 71.4% = 650 purchases, 50 more (+8.3%). The two are not the same effort, but the payment fix is concrete, near the money and measurable within a week. Neither number is a prediction; they show how to compare options.
Sessions that reach each step (sample data)
share of step one · sample monthHow do you do funnel analysis in TapCub?
In TapCub you build a funnel from any events or page paths, split it by a property, and open the people at any step, all from one set of data that also feeds your other reports. The steps below use the console menu names.
- Make sure the steps exist as events. TapCub's autocapture records clicks, submits and scrolls before you name them; the event inbox clusters them and suggests a name from rules or a model. Accepting a candidate creates a match rule and backfills the last 90 days, so a step can exist on historical data rather than only from the day you named it. Autocapture and the AI event inbox depend on your plan; check pricing. Industry packs also install ready-made funnels, such as a purchase funnel.
- Build the funnel. In All-platform analytics › Behavior › Behavior analysis, choose Funnels. Add 2 to 20 steps; each step is one or more event names (several names are treated as OR) or a page path, with wildcards, and can carry its own filters. Step by step guidance is in build a funnel.
- Set the rules. The window defaults to 7 days and can go up to 180 days. Order is ordered, strict or any order. Counting defaults to unique. You can require steps to share one session, add up to 5 exclusion events that cancel a conversion, and require the same value of a property on every step.
- Read it. Each step shows count, rate versus step one, rate versus the previous step, drop-off and median time from the previous step, with the largest drop marked. A trend plots conversion by entry time.
- Break it down. Breakdown uses one property and keeps the 10 largest groups. Click any step to open the people who arrived or dropped there.
Limits to know: breakdown uses only the first layer, there is no compare-period view, and with the strict privacy preset a visitor cannot be recognised across days. TapCub does not run A/B tests, so a funnel shows what changed, not an experiment; for the difference between funnels, goals and paths, see funnel vs goal vs path. Behavior analytics is part of TapCub Insights, alongside events, retention and paths, on the same snippet as your website statistics.
Where do you go from here?
This page is the overview; the rest of the cluster goes deeper on one question each.
- Avoid errors: funnel analysis mistakes.
- Improve the numbers: conversion funnel optimization.
- Choose software: funnel analytics tools.
- By use case: ecommerce funnel, marketing funnel and SaaS sales funnel.
- Calculate quickly: the funnel calculator.
- How-to in a product: build a funnel and read funnel drop-off.
FAQ
What is funnel analysis?
Funnel analysis measures how many people complete an ordered series of steps toward a goal and where they leave. You define the steps, count people at each one, and compare each step to the one before. The step with the weakest rate, or the most lost people, is where to investigate.
How do you do funnel analysis?
Pick one goal, list the actions that lead to it, make each action a measurable event or page, then set the order rule, time window and counting method. Read the count, step rate and median time, split by one property such as device, and fix one step at a time. Read the same funnel again over the same window.
What is conversion funnel analysis?
It is funnel analysis applied to a conversion goal such as purchase, sign-up or lead. The method is the same; the steps are the stages a visitor passes on the way to that conversion. The result is a conversion rate overall and for each step, which tells you where visitors leave.
What time window should I use?
Match the real cycle: minutes or hours for a checkout, days for a sign-up. Use the same window whenever you compare funnels, or you are comparing the window.
Which funnel analysis tool should I use?
Choose by whether it counts the way you need (sessions or people, same session or across sessions), lets you split by properties, and reads the events you already have. Compare options in funnel analytics tools. In TapCub, funnels are part of behavior analytics and need no separate setup beyond the events.
See also: funnel analysis mistakes and conversion funnel optimization.
See also: Product Analytics: What It Is, Key Metrics and How to Start; User Activation Rate: How to Define, Measure and Improve It
Sources
- Google. Funnel exploration, Analytics Help. Up to 10 steps; in an open funnel users can enter at any step, in a closed funnel they must enter at the first; breakdown attributes a user to the first applicable value; optional average elapsed time between steps. Read 2026-11-21.
- Mixpanel. Funnels: advanced concepts, documentation. Default 7-day conversion window, maximum 366 days; specific order (default) and any order; counting by uniques, totals or sessions; users count in each breakdown segment they qualify for. Read 2026-11-21.
- Mixpanel. Funnel analysis: find conversion problems (published 2021). Funnels explained with a platform-breakdown example; configuration controls: counting method, conversion window, ordering, exclusion steps and constant properties. Read 2026-11-21.
- Baymard Institute. Cart abandonment rate statistics. Average documented abandonment rate 70.22%, mean of 50 studies published 2006 to 2025; US shopper reasons include extra costs 40%, slow delivery 20%, distrust with card details 19%, account creation required 18%, long or complicated checkout 17%. Read 2026-11-21.
- TapCub documentation. Funnel model, event inbox and tracking plan pages in apps/docs, verified 2026-11-21.
Was this article helpful?
We use your answers to fix and expand this page.
Couldn’t send. Please try again in a minute.
Thanks for the feedback. We’ll use it to improve this page.You’ve already sent feedback on this page. Thanks.

Product Experience Specialist
Explores usability, user journeys, and feature adoption through practical examples of onboarding and everyday product use.