Try it on your own data
Every report in this article is in the free plan. One snippet for web and apps, up to 10 sites.
Start freeActivation rate is the share of new users who reach a key early milestone. This guide covers the formula, how to choose the activation event from retention data, the signup-to-activation funnel, how to read where users stall, and how to fix it with onboarding changes and a human nudge.
What you will learn
- Activation rate = users who reached the activation event within a window ÷ users who signed up; fix the event, window and denominator before you measure.
- Choose the event by comparing retained and churned signups, then prefer one that is early, predictive of retention and something the user does.
- Find the stall in the funnel, remove steps not on the path to the event, and offer a human nudge on the stuck step; read before-and-after results as observational.
What is activation rate?
Activation rate is the share of new users who reach a defined early milestone, the activation event, that shows they have experienced your product's core value. In formula terms: users who completed the activation event within a set window, divided by the users who signed up. If 280 of 1,000 signups create their first report within seven days, activation rate is 28.0%. User activation is the same idea seen from the person's side: the moment a signup turns into someone who actually got something out of the product.
It sits between two numbers you probably already watch. Signups tell you marketing worked; retention tells you the product worked over time; activation tells you whether new people got far enough to find out. Our guides to SaaS metrics and onboarding metrics place the number in the wider set. This guide covers the part they only touch on: choosing the event from data, finding where people stall, and acting on it.
How do you calculate activation rate?
Use this formula:
Activation rate = users who reached the activation event within the window ÷ users who signed up in the same period × 100
Three choices decide whether the number means anything.
- The denominator. Amplitude's activation rate guide divides by new users; Lenny's Newsletter's benchmark post (2022) divides by users who completed the signup flow. They give different numbers, so pick one and keep it. Counting all signups is the stricter choice.
- The window. Amplitude's example uses seven days after signup, and suggests picking a timeframe such as 24 hours, three days, seven days or 30 days. Fix the window before you measure, and only count cohorts old enough to have completed it.
- The event. The next section covers this one. Amplitude warns against defining it too broadly (a signup or a login) or too narrowly (advanced usage that excludes people already getting value).
Compute the rate per signup cohort (this week's signups, last week's), not as a running total, so you can see a change after you ship one.
How do you find your activation event from data?
Treat the activation event as a hypothesis you test against retention, not as the step your team likes best. The method, which both Amplitude and Lenny's Newsletter describe in different words:
- List candidate events. Early, concrete actions a person takes: completed onboarding, connected data, created the first project, invited a teammate, received a first result.
- Compare retained and churned signups. Take one signup cohort that is old enough to judge, split it into people still active at day 30 and people who left, and check how many in each group did each candidate within the first week. Amplitude suggests exactly this comparison of early actions between retained and churned users.
- Prefer events that are early, predictive and actionable. Lenny's Newsletter advises a milestone that is early in the lifecycle and strongly tied to retention (users who hit it should retain at least twice as well as those who do not), something the user does rather than an account-level fact, and neither too early (finishing signup) nor too late (several purchases).
- Test causality. Correlation is where you start. Both sources say to confirm that improving the milestone also improves later retention or revenue. People who connect data may stay because they were serious from the start.
Here is the comparison with sample data (not a real product): 1,000 signups, 300 of them still active at day 30.
| Candidate event | Did it | Retained at day 30 | Did not do it | Retained at day 30 | Ratio |
|---|---|---|---|---|---|
| Completed profile | 700 | 235 (33.6%) | 300 | 65 (21.7%) | 1.5x |
| Invited a teammate | 250 | 110 (44.0%) | 750 | 190 (25.3%) | 1.7x |
| Connected data in 24 hours | 400 | 200 (50.0%) | 600 | 100 (16.7%) | 3.0x |
| Created first report within 7 days | 280 | 182 (65.0%) | 720 | 118 (16.4%) | 4.0x |
Each row reconciles: 235 + 65 = 300 and 182 + 118 = 300 retained. "Created first report" separates retained from churned best (65.0% against 16.4%) and 280 of 1,000 can reach it, so it is the activation event here. "Connected data" is the step you must pass to get there, which makes it the one to work on. Profile completion is common and weakly predictive, so it is not activation, even though it feels like progress.
| Candidate event | Did it | Retained at day 30 | Did not | Retained at day 30 | Ratio |
|---|---|---|---|---|---|
| Completed profile | 700 | 235 (33.6%) | 300 | 65 (21.7%) | 1.5x |
| Invited a teammate | 250 | 110 (44.0%) | 750 | 190 (25.3%) | 1.7x |
| Connected data in 24 hours | 400 | 200 (50.0%) | 600 | 100 (16.7%) | 3.0x |
| Created first report within 7 days | 280 | 182 (65.0%) | 720 | 118 (16.4%) | 4.0x |
Sample data: 1,000 signups, 300 retained at day 30. Correlation, not proof of cause.
How do you build the signup-to-activation funnel?
Once the event is chosen, put it at the end of an ordered funnel that starts at signup. Use the same events and the same window as the formula. For the sample product:
- Signed up.
- Answered the role questions.
- Invited teammates.
- Connected a data source.
- Created the first report (the activation event).
Set the funnel window to match your activation window, seven days here. A funnel gives you the number you need for each step: how many entered, the conversion from the previous step, the drop-off, and the median time from the previous step. The first of those finds the weakest step; the last tells you whether people stall in a step or fail at it. The mistakes that distort funnels are in funnel analysis mistakes. Use the funnel's first-to-last rate as your activation rate, so funnel and formula agree.
Break it down by one property at a time: plan, acquisition channel, device or country. A low overall rate that is fine for one channel and terrible for another is a marketing problem, not an onboarding problem. Geckoboard makes the same point in its activation rate KPI guide: a low rate can also mean marketing is attracting poor-fit signups, and the rate says nothing about whether activated users stay or pay.
Where do new users stall, and how do you read it?
Look at three things, in this order.
The step with the largest drop-off. In the sample in the next section, the biggest loss is between "Answered the role questions" and "Invited teammates" (800 to 560, a loss of 240 people). But the biggest loss is not always the place to act: ask whether the step is needed to reach activation. Inviting teammates is not required to create a first report, so that step is a candidate for moving, not polishing.
Time to first key action. The median time between steps tells you whether people are slowly working through a step or have given up. A long median before "Connected a data source" can mean people lack something at hand, such as credentials or someone else's permission. That is a different fix from a confusing screen.
What stalled users do instead. A path report shows where signups who did not activate went next: back to the home page, to pricing, to the docs, or away.
Then open individual people. Click a funnel step to see the people who dropped there and read a few timelines. A dozen timelines say more about why than another chart will.
What worked example shows the effect of moving the key step?
Sample data again, recomputed here. A product with 1,000 signups, a five-step flow, and activation defined as "created first report within 7 days". The original flow puts the key action last:
| Step (original order) | Users | Rate vs previous step |
|---|---|---|
| 1. Signed up | 1,000 | n/a |
| 2. Answered role questions | 800 | 80.0% |
| 3. Invited teammates | 560 | 70.0% |
| 4. Connected a data source | 360 | 64.3% |
| 5. Created first report | 280 | 77.8% |
Activation is 280 ÷ 1,000 = 28.0%. Most people who reach step 4 make it to step 5 (77.8%), so the leak is in front of the key action, not in it. The team moves "Connect a data source" to step 2, makes "Created first report" step 3, and pushes role questions and teammate invites to after activation, where they are skippable. A next cohort of 1,000 signups goes through:
| Step (new order) | Users | Rate vs previous step |
|---|---|---|
| 1. Signed up | 1,000 | n/a |
| 2. Connected a data source | 620 | 62.0% |
| 3. Created first report | 360 | 58.1% |
| 4 and 5. Role questions, invites | after activation | n/a |
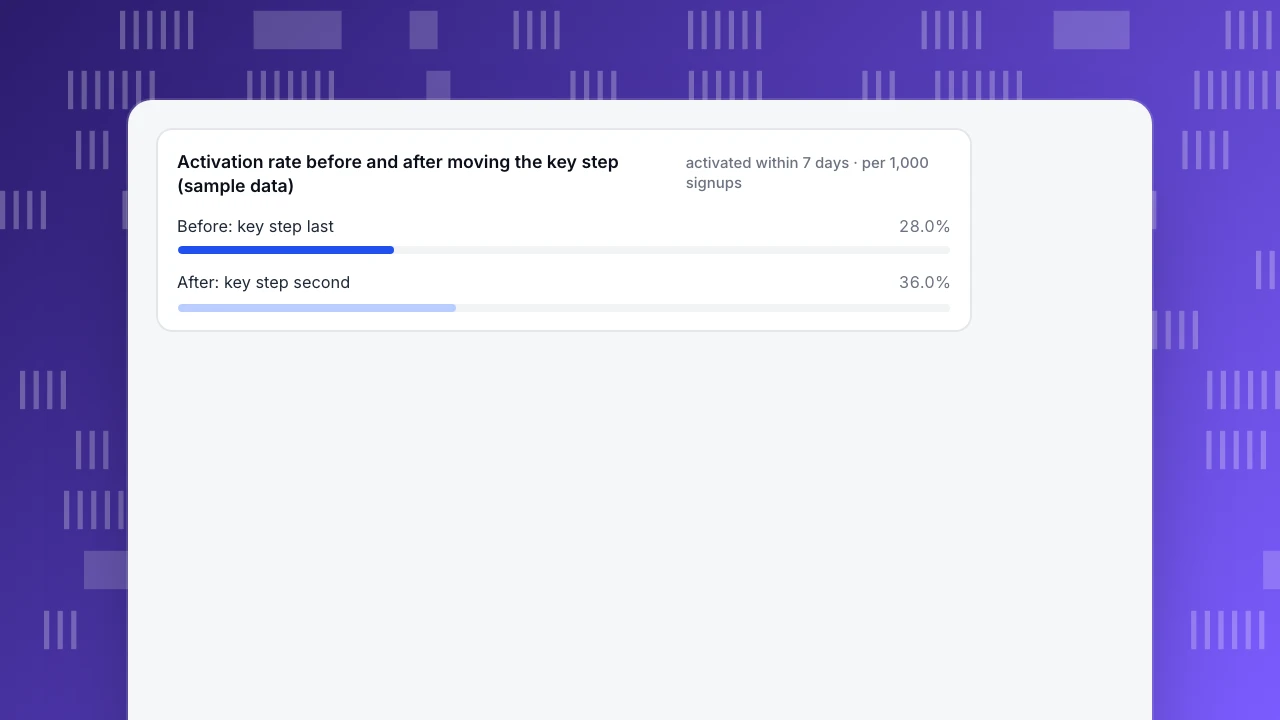
Activation is 360 ÷ 1,000 = 36.0%, an increase of 8.0 percentage points, which is 80 more activated users per 1,000 signups and a relative change of 8.0 ÷ 28.0 = 28.6%.
Read this with care. It is a before-and-after comparison of two cohorts, not a controlled experiment. A different traffic mix, a campaign or seasonality in the second cohort could also move the number. The conclusion is modest: activation rose after a change you can name, so keep it and watch the next two cohorts. Also check that day-30 retention of the newly activated users stays near that of the old ones; if it drops, you made the event easier to hit without making it more meaningful.
Activation rate before and after moving the key step (sample data)
activated within 7 days · per 1,000 signupsHow do you fix a stalled step with onboarding and a human nudge?
Work from the cheapest fix to the heaviest.
- Remove steps that are not on the path to the activation event. Move them after activation, or make them skippable. This is what the example did. The onboarding flow and sign up flow guides cover step design in detail.
- Shorten the distance. Put the key step early, pre-fill what you can, and offer sample data so a person sees a first result before connecting anything real.
- Fix the specific blocker. If time-to-first-action is long at one step, find what is missing from the stalled-user timelines and put the answer on the screen. User onboarding goes deeper on finding the aha moment.
- Talk to the person who is stuck. Some blockers are not fixable by a screen. A proactive chat invite on the stalled step, after the time a normal user needs, lets a real person offer help at the exact moment someone hesitates. Keep it specific: "Stuck connecting your data? Tell me which source and I will walk you through it." One line, tied to the page, is better than a general pop-up.
Judge the invite by the reply rate, not by assuming it works. A rule you cannot test against a control group is a hypothesis; if nobody replies to it, retire it.
What is a good activation rate?
There is no single number, and the sources that publish benchmarks say so. The most-quoted public figures come from Lenny's Newsletter's survey of over 500 responses across eight product types, published in October 2022: an average activation rate of 34% and a median of 25% across all products, and for SaaS alone an average of 36% and a median of 30%. They are self-reported by a newsletter audience, depend on each respondent's own activation definition, and are several years old. Geckoboard says directly that industry comparisons are only loosely useful because activation definitions vary so widely.
Use benchmarks to check whether you are in the right region, not to set a goal. The sample's 28.0% is below that SaaS median of 30% and its 36.0% equals the SaaS average, but the comparison is weak because the sample's definition is not theirs. A better target is your own trend: this cohort against the last four, and after each change. Pair the rate with retention too, because activation that does not lead to staying is a poor definition. The retention metrics and good retention rate guides cover the other side, and churn prevention what to do about people who still leave.
How do you measure activation in TapCub?
The pieces are in one project, on the same events. The steps use the console's menu names and the product documentation. Event names below are examples; use your own.
- Send events from day one. Track the signup and the key actions (for example
signed_up,data_source_connected,report_created) withtrack(), or accept autocapture candidates from Data › Event inbox; accepting one creates a match rule and backfills the last 90 days. Server-side events count too, which suits signup and payment. - Set the activation event. In Business settings, the AARRR tab takes a signup event and an activation event. Activation starts empty, so set it to a real action rather than a pageview. The AARRR report then shows activation as people and a rate, counting new users who do the event in the period or within 7 days after it ends.
- Build the funnel. In Behavior analysis, create a funnel with your steps (2 to 20), a window of 7 days by default, and read count, step conversion, drop-off and median time per step. Break down by one property such as channel or plan. Click a step to see the people who dropped there.
- Read the stalls. Use the path report from a start page or event to see where non-activators go next, and open a person to read the timeline (identified users appear after
tapcub.login()). - Check retention by activation. Run retention with signup as the start event, and filter with a segment of people who did or did not do the activation event, to compare the curves. Segments are rule-based ("did", "did not", property, first seen) and refresh daily or on demand.
- Talk to stuck users. Add a rule in Live chat › Chat settings › Proactive invites: match the onboarding page by path, set a dwell time (3 to 600 seconds), and write the invite (up to 300 characters). The chat sits on the same visitor data, so an agent sees the page and recent activity next to the conversation. The rule list shows impressions, open rate and reply rate.
Limits worth knowing. Invites trigger on page and dwell time only, not on segment or behaviour. TapCub does not run A/B tests or feature flags, so a before-and-after like the example is observational. The activation event needs a 7-day window to complete, so the newest cohort looks low until it matures. For the industry setup, see the SaaS solution page and, for the data model behind it, SaaS analytics.
FAQ
What is a good activation rate?
Published figures vary by definition. Lenny's Newsletter's 2022 survey of 500+ responses reported a SaaS average of 36% and a median of 30%. Treat these as context only; your own trend by signup cohort matters more.
How is activation different from retention?
Activation is whether new users reach a key milestone early; retention is whether users come back later. Use retention to validate the activation event: people who reach it should retain much better than those who do not.
How do I define the activation event?
Compare early actions of retained and churned signups, then pick an event that is early, predictive of retention and something a user does. Treat it as a hypothesis and re-test it as the product changes.
How do I improve user activation?
Find the step with the largest avoidable drop-off, remove steps not on the path to the event, shorten the time to the first result, fix the specific blocker, and offer a human nudge at the stuck step. Track cohort rates before and after, and treat the results as observational.
See also: SaaS customer journey, SaaS sales funnel and insights.
See also: Funnel Analysis: How to Build, Read and Fix a Funnel; Product Analytics: What It Is, Key Metrics and How to Start
Sources
- Amplitude. What is activation rate (page undated) — activation rate = share of new users reaching a key milestone; example 300 of 1,000 signups = 30%; timeframes such as 24 hours to 30 days; compare retained and churned users' early actions; treat the definition as a hypothesis; avoid too broad or too narrow. Vendor guide. Read 2026-11-21.
- Lenny's Newsletter (2022). What is a good activation rate (published 2022-10-25) — over 500 responses, eight product types; all products average 34%, median 25%; SaaS average 36%, median 30%; milestone early, predictive (at least 2x retention) and actionable; confirm causality with experiments. Survey data from a newsletter audience. Read 2026-11-21.
- Geckoboard. Activation rate KPI — formula signups completing the milestone divided by total signups; benchmarks only loosely useful; low rate can mean poor-fit signups; rate does not show retention or payment. Vendor guide. Read 2026-11-21.
- TapCub documentation (verified 2026-11-21): funnels, retention, paths, segments, people, event inbox, AARRR, proactive messages.
Was this article helpful?
We use your answers to fix and expand this page.
Couldn’t send. Please try again in a minute.
Thanks for the feedback. We’ll use it to improve this page.You’ve already sent feedback on this page. Thanks.

Data Engineer
Writes about event design, data quality, and collection workflows, with verifiable implementation methods for reliable analytics.