Try it on your own data
Every report in this article is in the free plan. One snippet for web and apps, up to 10 sites.
Start freeUpper funnel marketing is judged by reach, engaged sessions and assisted conversions, because the people it reaches rarely buy in the same session. In the sample below, awareness social costs $500 per conversion on last-click but $85.71 on first-touch and $0.66 per engaged session, so last-click alone would cut it wrongly. Pair delivery with behaviour, show two attribution models and give the window time.
What you will learn
- Pair a delivery metric (reach) with a behaviour metric (engaged sessions, new visitors, return visits)
- Show at least two attribution models side by side; the gap between them is your uncertainty
- Judge over a window matched to your sales cycle, not the day after the campaign
What counts as upper funnel marketing?
Upper funnel marketing is work aimed at people who do not yet know they need you: awareness and early consideration, through video, social, content, PR, sponsorships or broad search. Its goal is not an immediate purchase. It is to be remembered and visited when the need appears. The definition matters less than a measurement fact: the people it reaches rarely convert in the same session, so judging it by last-click sales is like judging a billboard by whether anyone bought on the spot. For the stage itself see top of funnel, and for the whole model see the marketing funnel.
The practical problem is proof. A budget holder will ask what the spend did, and "impressions" is not an answer a finance team trusts. What you need is a short list of metrics that can be measured from your own site, move before sales do and are hard to fake. The next sections give that list, a worked example of how last-click misleads, and how long to wait before judging.
Which metrics prove upper funnel work?
Use different metrics at different distances from the sale. The table is the core of this article.
| Stage question | Metric | Where it comes from | What a good sign looks like |
|---|---|---|---|
| Did the right people see it? | Reach, impressions, frequency | Ad platform or publisher | Reach in your target audience, frequency not extreme |
| Did they come to the site? | Sessions and new visitors from the campaign | Your analytics, tagged links | New-visitor sessions rise during and after the campaign |
| Did they pay attention? | Engaged-session share, pages per session, return visits | Your analytics | Engaged share close to or above your other channels |
| Did they remember you? | Direct visits and branded search clicks | Analytics, search console | Rise lagging the campaign by days or weeks |
| Did they help later? | Assisted conversions, first-touch conversions | Attribution report | Conversions where this channel appeared earlier in the path |
| Did it pay? | Cost per engaged session, cost per assisted conversion | Spend plus the above | Falling or stable against alternatives |
Two rules make this table honest. First, pair a delivery metric with a behaviour metric: reach alone says you bought attention, an engaged session says someone gave some back. Second, never put a revenue number on awareness alone: put the assisted-conversion count next to it and let the reader judge.
| Stage question | Metric | Good sign |
|---|---|---|
| Did the right people see it? | Reach, frequency | Reach in target audience |
| Did they come? | Sessions, new visitors | New-visitor sessions rise |
| Did they pay attention? | Engaged share, return visits | Close to other channels |
| Did they remember you? | Direct and branded search | Rises with a lag |
| Did they help later? | Assisted, first-touch conversions | Appears earlier in paths |
| Did it pay? | Cost per engaged session | Falling or stable |
Never put a revenue number on awareness alone; show assisted conversions beside it.
How does last-click make awareness look worthless?
Sample data: three channels over one quarter. Spend, sessions, the share of sessions that were engaged, and conversions credited under three attribution rules.
| Channel | Spend | Sessions | Engaged share | Last-click | First-touch | Linear |
|---|---|---|---|---|---|---|
| Awareness social | $6,000 | 24,000 | 38% | 12 | 70 | 40.0 |
| Search | $4,000 | 8,000 | 70% | 96 | 66 | 72.0 |
| $500 | 3,000 | 60% | 52 | 24 | 48.0 | |
| Total | $10,500 | 35,000 | — | 160 | 160 | 160.0 |
Each attribution column adds to the same 160 conversions; only the credit moves. Now divide spend by credit to get cost per conversion:
| Channel | Cost per conversion, last-click | First-touch | Linear | Cost per engaged session |
|---|---|---|---|---|
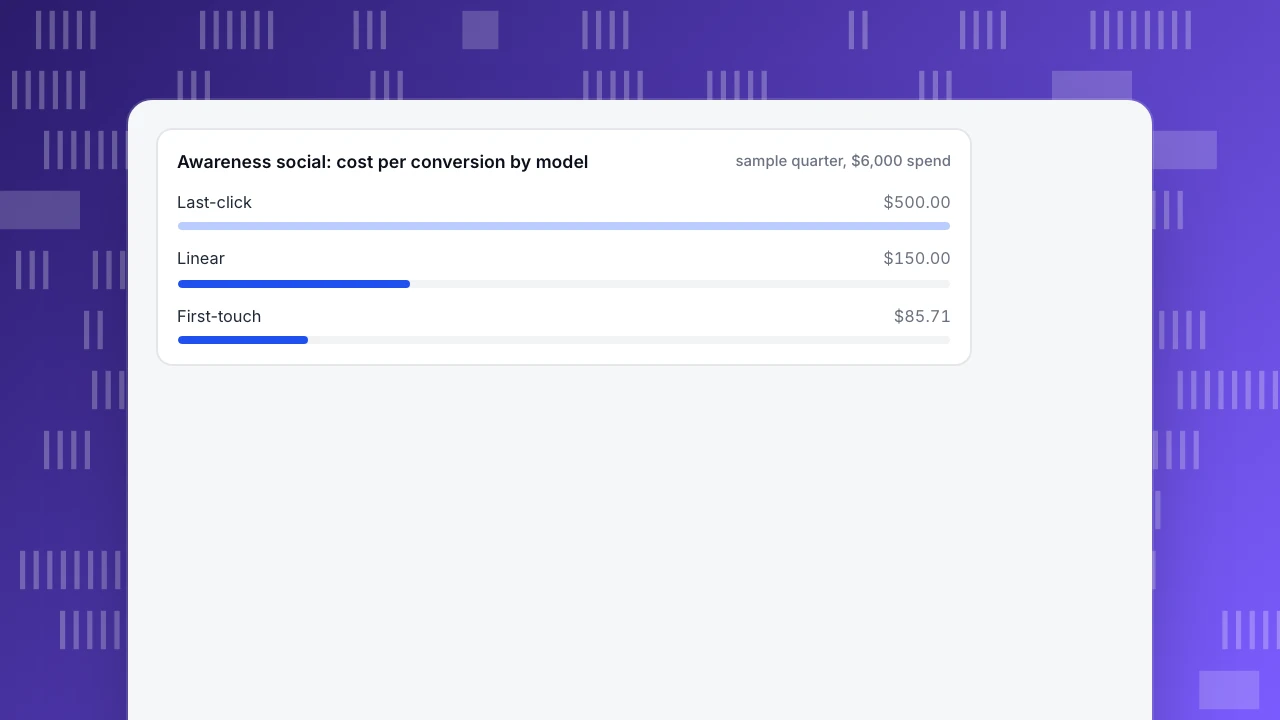
| Awareness social | $500.00 | $85.71 | $150.00 | $0.66 |
| Search | $41.67 | $60.61 | $55.56 | $0.71 |
| $9.62 | $20.83 | $10.42 | $0.28 |
How to recompute: social's engaged sessions are 24,000 × 38% = 9,120, so $6,000 ÷ 9,120 = $0.66; cost per conversion is spend ÷ credit ($6,000 ÷ 12 = $500; ÷ 70 = $85.71; ÷ 40 = $150). Search's engaged sessions are 8,000 × 70% = 5,600 and $4,000 ÷ 5,600 = $0.71.
Read the two tables together. Under last-click, awareness social costs $500 per conversion, twelve times search's $41.67, and would be cut. Under first-touch it costs $85.71, in the same range as search. On cost per engaged session it is $0.66, close to search's $0.71. The honest conclusion is not that social is better or worse; it is that last-click alone cannot decide, because social starts journeys that other channels finish. A reasonable decision would be to keep social, watch cost per engaged session and the first-touch count, and test lowering spend in a way that lets you see whether search conversions fall afterwards.
The reverse caution applies too: first-touch over-credits the top of the funnel and gives nothing to the channel that closed. Show at least two models side by side, and treat the gap between them as the uncertainty.
Awareness social: cost per conversion by model
sample quarter, $6,000 spendHow do you measure engagement quality?
"Sessions" from awareness traffic can be low quality: accidental clicks, curiosity visits, bounces. Measure the share that did something.
A common definition comes from Google Analytics 4: a session is engaged if it lasts longer than 10 seconds, includes a key event, or has two or more page or screen views (Google Analytics Help, checked 2026-11-21). In the sample, 38% of social sessions were engaged against 70% from search. That gap is expected for cold audiences. What matters is the trend and the comparison with similar channels: if engaged share on a new video campaign is 38% and your other cold channels are at 20%, it is working; if it is at 5%, the creative or targeting is bringing the wrong people.
Add three behaviour checks that need no special tool:
- New-visitor share. Is the campaign bringing people you have not seen before? A campaign that mostly reaches people who already visit is retargeting, not awareness.
- Depth. Pages per session and whether the visit reached a core page (pricing, product, a long article).
- Return rate. The share of campaign visitors who come back within 30 days. This is the closest site-side proxy for "remembered us".
How long should you wait before judging?
Upper funnel effects are slow, so the measurement window must be longer than the one you use for paid search. Google Analytics attribution settings show how platforms think about it: the default lookback window is 30 days for acquisition events and 90 days for other key events, adjustable to 7 days for acquisition and to 30 or 60 days for the others (Google Analytics Help, checked 2026-11-21). A touch more than 30 or 90 days before the conversion gets no credit at all.
Use three habits:
- Compare windows, not days. Judge the four weeks after a campaign against the four weeks before, adjusted for season, instead of looking at day-after sales.
- Match the window to your sales cycle. If the typical path from first visit to purchase is 45 days, a 30-day lookback loses the awareness touches that started it.
- Mark what you changed. Annotate campaign start and end on your charts so that a rise in direct visits three weeks later has a visible cause.
The Institute of Practitioners in Advertising has warned that using very short-term online metrics as primary measures of performance "has dangerous implications for long-term success" (IPA, The Long and the Short of It, checked 2026-11-21). The point for a small team is simple: report both a short-term and a long-term set of metrics, and do not cancel top-of-funnel work because last-click does not show it.
How should you report upper funnel results?
A leadership page needs four lines, not a dashboard:
- Reach and cost: reach in the target audience and spend.
- Quality: engaged-session share and new-visitor share, compared with other channels.
- Contribution: first-touch and assisted conversions, shown with last-click, with the models labelled.
- Lag effects: direct and branded search change in the four weeks after, with the caveat that other causes exist.
State what you know and what you infer. "Sessions from the campaign rose 24,000 with 38% engaged and 70 first-touch conversions" is a fact. "The campaign caused the rise in branded search" is an inference, so label it.
How do you measure this in TapCub?
Use the sample above as the walk-through. TapCub does not buy media or deliver impressions; reach and frequency stay in the ad platform. It measures what happens after the click.
- Tag the links. Use UTM parameters on every campaign link, then read Web analytics › Sources (the UTM tab) for visitors, sessions, bounce and duration per campaign. Bots are counted separately so they do not inflate awareness traffic.
- Import spend. In All-platform analytics › Business › Channel ROI import cost by day, channel, source or campaign (CSV or one by one). TapCub then shows cost per click (spend ÷ sessions), cost per acquisition (spend ÷ purchases in orders) and return on ad spend, grouped by channel, source or campaign.
- Compare attribution models side by side. In All-platform analytics › Behavior › Behavior analysis pick the attribution view and select first, last, linear, position and time-decay together; each model gets its own column, so a channel that only assists is easy to spot. The touchpoint defaults to channel, the lookback window defaults to 30 days (1 to 90 days) and includes the converting session. Up to 50,000 conversions are calculated.
- Watch the lag. Mark the campaign with a date annotation (Configuration › Annotations) and watch direct and search visits on the charts for the weeks that follow.
- Alert on the cause you care about. Add a monitor on sessions to catch a tracking break during a campaign.
TapCub is not an attribution provider for app installs and does not match clicks to installs; the models above work on website and in-product sessions before a conversion.
What mistakes make awareness metrics useless?
- Reporting impressions alone. Pair delivery with a behaviour metric.
- Judging on last-click. It gives nothing to the first touch.
- Using too short a window. A 30-day lookback loses long journeys.
- No baseline. A rise means little without the weeks before.
- Attributing all branded search growth to one campaign. Seasonality, PR and word of mouth also move it.
FAQ
What is upper funnel marketing?
Upper funnel marketing is activity aimed at people who do not yet know they need your product: awareness and early consideration through video, social, content and broad search. Its aim is to be remembered and visited later rather than to produce an immediate sale.
What metrics measure upper funnel marketing?
Reach and frequency from the ad platform; new visitors, engaged sessions and return visits from your analytics; direct visits and branded search as lagging signals; and first-touch and assisted conversions from attribution. Cost per engaged session ties spend to quality.
How do you measure the ROI of awareness campaigns?
Compare cost per engaged session and cost per assisted or first-touch conversion across channels, using at least two attribution models, and judge over a window matched to your sales cycle. Do not use last-click alone, which gives awareness no credit.
Why does upper funnel marketing look bad in last-click reports?
Last-click gives all credit to the final touch before a conversion. Awareness touches come earlier, so they show few direct conversions even when they started the journey. In the sample, social has 12 last-click conversions but 70 first-touch conversions.
How long does upper funnel marketing take to work?
It varies with your sales cycle. Look at windows of at least 30 days and align with your typical time from first visit to purchase. Google Analytics defaults to 30 days for acquisition events and 90 days for other key events.
Sources
- Google Analytics Help: Engagement rate and engaged sessions, checked 2026-11-21
- Google Analytics Help: Attribution settings and lookback windows, checked 2026-11-21
- IPA: The Long and the Short of It, checked 2026-11-21
Was this article helpful?
We use your answers to fix and expand this page.
Couldn’t send. Please try again in a minute.
Thanks for the feedback. We’ll use it to improve this page.You’ve already sent feedback on this page. Thanks.

Product Analyst
Focuses on event analysis, conversion funnels, and retention, using clear metric definitions and structured analysis to explain product performance.