Try it on your own data
Every report in this article is in the free plan. One snippet for web and apps, up to 10 sites.
Start freeSaaS analytics measures a subscription business in four stages: acquisition, activation, retention and revenue, with no more than three numbers each. Read them in order, because a fall in one stage is usually explained by the one before. In the sample month, MRR grew 14.5% while net revenue retention was 98.5%.
What you will learn
- Keep at most three numbers per stage and read the stages in order
- Use cohorts for retention and define active by a key action, not a login
- Check net revenue retention before celebrating total MRR growth
What is SaaS analytics, and which questions does it answer?
SaaS analytics is measuring a subscription software business in four stages: how people arrive, whether they reach first value, whether they keep using the product, and how revenue changes. It needs two kinds of data that live in different systems: product behaviour (events such as sign-up and feature use) and billing (subscriptions, amounts, cancellations). Most confusion comes from mixing them.
Each stage has one question and should have no more than three numbers:
| Stage | The question | Key numbers (at most three) | Mostly from |
|---|---|---|---|
| Acquisition | Where do sign-ups come from, and at what cost? | Visitor-to-sign-up rate, sign-ups by channel, acquisition cost | Web analytics, ad spend |
| Activation | Do new users reach first value? | Activation rate, time to activate | Product events |
| Retention | Do they keep coming back? | Retention by cohort week, active accounts | Product events |
| Revenue | Is the recurring revenue growing? | MRR movement, net and gross revenue retention, churn | Billing |
For the long list of definitions, see SaaS metrics; for the billing side in detail, subscription analytics; for the framework that ties product data to these stages, product analytics framework. This article's claim is: read the four stages in order and keep only a few numbers per stage, because a fall in one stage is usually explained by the one before it.
| Stage | The question | Key numbers |
|---|---|---|
| Acquisition | Where do sign-ups come from, at what cost? | Sign-up rate, sign-ups by channel, acquisition cost |
| Activation | Do new users reach first value? | Activation rate, time to activate |
| Retention | Do they keep coming back? | Cohort retention, active accounts |
| Revenue | Is recurring revenue growing? | MRR movement, NRR and GRR, churn |
Product events feed the first three stages; billing feeds revenue.
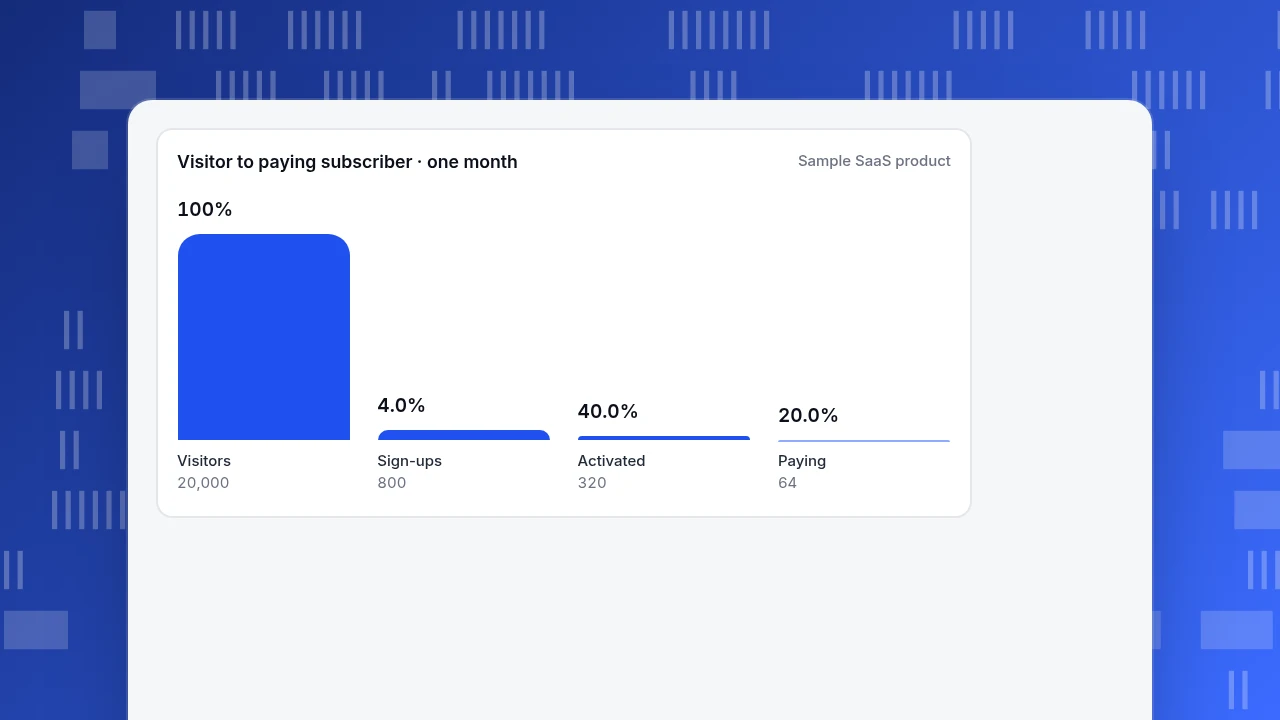
What does one month of SaaS numbers look like?
Sample data: a subscription product, one month, starting with 400 subscribers at $50 average monthly revenue per account (ARPA).
| Stage | Number | Calculation |
|---|---|---|
| Visitors | 20,000 | |
| Sign-ups | 800 | 800 ÷ 20,000 = 4.0% |
| Activated users | 320 | 320 ÷ 800 = 40.0% |
| New paying subscribers | 64 | 64 ÷ 320 = 20.0% of activated, 8.0% of sign-ups |
| Starting MRR | $20,000 | 400 × $50 |
| Churned MRR | $900 | |
| Expansion MRR | $600 | |
| New MRR | $3,200 | 64 × $50 |
| Ending MRR | $22,900 | 20,000 − 900 + 600 + 3,200 |
| Ad spend | $6,400 |
Two derived figures: acquisition cost per paying subscriber is $6,400 ÷ 64 = $100; and payback is $100 ÷ ($50 × 80% gross margin) = 2.5 months. Compare payback with how long customers tend to stay: if payback is 2.5 months and typical customers stay 20 months, the economics have room; if most cancel within 3 months, they do not. The next four sections read each stage from this one table.
Visitor to paying subscriber · one month
Sample SaaS productVisitors
20,000
Sign-ups
800
Activated
320
Paying
64
Stage 1: how do you read acquisition?
Acquisition numbers answer where sign-ups come from, split by channel, not the average. The sample's 4.0% visitor-to-sign-up rate is an average over channels that behave very differently; the useful table is sign-ups and paying customers per channel and spend per paying customer. Measure two things:
- Sign-up rate by source: sign-ups ÷ visitors from that source.
- Acquisition cost per paying subscriber: ad spend ÷ new paying subscribers. In the sample, $100.
A channel that brings cheap sign-ups but few payers has a good sign-up rate and a bad cost per payer; judge it by the second. The same rule applies to visits in general: split by source before you total.
Stage 2: what is activation, and how do you define it?
Activation is the share of new sign-ups who reach the first moment of value. The definition is a product decision: pick the action that best separates people who stay from people who leave, for example "sent the first invoice" or "invited a teammate", not "logged in".
The sample's activation rate is 320 ÷ 800 = 40.0%. Read it with time: activation within 7 days of sign-up is a fair window, because later activators belong to a different conversation. If activation is low, look at the step where new users stop between sign-up and the first value, with a funnel; activation rate has the definition and variants.
A common error is to count activation in the same period as sign-up. People who signed up on the 28th have not had time to activate, so the rate for the latest cohort is always understated. Give every cohort the same window.
Stage 3: how do you measure retention for a SaaS product?
Retention is whether sign-ups from a given week are still using the product weeks later. Use cohorts, not a blended percentage: a blended number is dominated by whoever joined recently.
Sample data: a cohort of 1,000 sign-ups, and the share still active in a key action.
| Week after sign-up | Still active | Share |
|---|---|---|
| Week 1 | 450 | 45% |
| Week 4 | 280 | 28% |
| Week 8 | 220 | 22% |
| Week 12 | 200 | 20% |
The shape matters more than any single point: the curve falls fast and then flattens at about 20%. The flat part is your retained core, and improving the first four weeks, where most of the loss happens, is what moves it. Definitions are in retention and retention curve. Define "active" by a key action, not by a login, so a user who only opens the app is not counted as retained.
Stage 4: how do you read revenue, churn and net revenue retention?
Revenue analytics starts with the movement of recurring revenue in a period: starting MRR, plus new, plus expansion, minus churned. Two ratios turn it into health measures:
- Gross revenue retention = (starting MRR − churned MRR) ÷ starting MRR = (20,000 − 900) ÷ 20,000 = 95.5%.
- Net revenue retention = (starting MRR − churned + expansion) ÷ starting MRR = (20,000 − 900 + 600) ÷ 20,000 = 98.5%.
Neither includes new customers. Net revenue retention below 100% means the existing base is shrinking, even though total MRR grew from $20,000 to $22,900 because of $3,200 in new MRR. That is the point to watch: growth bought by acquisition can hide a leaking base.
Logo churn is the other view: 20 cancelled out of 400 is 5.0%. Keep revenue churn and logo churn apart, because losing one large account and ten small ones look the same in count and different in revenue. Definitions are in churn, net revenue retention and gross revenue retention.
How do you join product data and billing data?
The four stages need both systems to agree on who a customer is. The checks that save the most trouble:
- A shared identifier. The user ID or account ID in product events must match the one in billing; anonymous visitors have none until they sign up.
- Server-side payment events. Send subscription and payment events from your server, not the browser, so ad blockers and closed tabs do not lose revenue.
- One currency and one time zone. Convert amounts to a base currency and cut days in one zone.
- Plan as a property. Attach the plan to events so every stage can be split by plan.
- Accounts, not only people. For team products, attach events to the customer account, because one account has several users.
If the sign-up count in your product and the new-subscriber count in billing disagree beyond trials and refunds, fix the identifier before you analyse anything else.
Common mistakes in SaaS analytics
- Tracking thirty metrics. Pick three per stage.
- Blended retention. Without cohorts, growth hides churn.
- Declaring victory on total MRR. The sample grew 14.5% while net revenue retention was 98.5%.
- Defining activation as a login. It measures curiosity, not value.
- Different windows per cohort. The newest cohort will always look worse.
- Mixing logo and revenue churn. They answer different questions.
- Ignoring payback. A channel with a 2.5-month payback and one with a 14-month payback look the same on a sign-up chart.
How do you run SaaS analytics in TapCub?
TapCub covers the behaviour side and can carry subscription events you send; it is not a billing system and does not read yours. For the sample product:
- Start from the pack. Install the B2B / SaaS pack from All-platform analytics › Business › Industry packs. It defines events such as
signed_up,feature_used,trial_started,subscription_started(withplanandmrr),payment_succeededandsubscription_cancelled, plus goals, funnels and dashboards; the subscription amount should be sent by your server. The metric and dashboard names the pack creates are stored in Chinese. - Read the four stages together. All-platform analytics › Business › AARRR growth puts acquisition, activation, retention, revenue and referral side by side; activation counts new users who do the activation event in the period or within 7 days after it ends, and day-7 retention is the share who return on any of the next 7 days.
- Cohorts and lifecycle. All-platform analytics › Behavior › Behavior analysis gives retention by cohort and a lifecycle view of new, retained, resurrected and dormant users.
- Accounts. After login, call
tapcub.group('company', 'acme', {...})to roll people up into accounts: All-platform analytics › Users › Accounts shows active accounts, members and a 0 to 100 health score. Account views show the organisation, not individual detail. - Acquisition cost. Import spend in All-platform analytics › Business › Channel ROI to see cost per click, cost per acquisition and return on ad spend; orders come from the purchase event, so for subscriptions map the purchase event to your subscription event.
TapCub does not process payments, send dunning emails or compute revenue from your billing system: MRR is only as good as the events you send.
FAQ
What is SaaS analytics?
SaaS analytics is measuring a subscription software business across acquisition, activation, retention and revenue. It combines product behaviour data, such as sign-ups and feature use, with billing data, such as subscriptions and cancellations.
Which metrics matter most for a SaaS business?
Keep a few per stage: visitor-to-sign-up rate and acquisition cost; activation rate; retention by cohort; and net and gross revenue retention with churn. In the sample, a 98.5% net revenue retention showed a leaking base despite 14.5% MRR growth.
How do you calculate net revenue retention?
Net revenue retention = (starting MRR − churned MRR + expansion MRR) ÷ starting MRR, excluding new customers. In the sample, (20,000 − 900 + 600) ÷ 20,000 = 98.5%. Below 100% means the existing customers are paying less than a month ago.
What is the difference between SaaS analytics and product analytics?
Product analytics covers behaviour inside the product: events, funnels, retention. SaaS analytics adds the subscription business: billing, MRR movements, churn and acquisition cost. You need both and a shared customer identifier to connect them.
How do you measure activation in SaaS?
Pick the first action that separates users who stay from those who leave, such as sending a first invoice, and measure the share of new sign-ups doing it within a fixed window such as 7 days. In the sample, 320 of 800 activated, or 40.0%.
Sources
- Wikipedia. Churn rate — customer and revenue churn definitions. Verified 2026-11-19.
- Wikipedia. Cohort analysis — why cohorts, not blended averages, show behaviour over time. Verified 2026-11-19.
- Wikipedia. Customer acquisition cost — definition and use with lifetime value. Verified 2026-11-19.
- Wikipedia. Software as a service — the delivery model behind subscription revenue. Verified 2026-11-19.
Was this article helpful?
We use your answers to fix and expand this page.
Couldn’t send. Please try again in a minute.
Thanks for the feedback. We’ll use it to improve this page.You’ve already sent feedback on this page. Thanks.

Product Experience Specialist
Writes about product experience, practical workflows, and growth, turning complex processes into clear steps for everyday decisions.