Try it on your own data
Every report in this article is in the free plan. One snippet for web and apps, up to 10 sites.
Start freeTo pick product analytics tools, compare five things you can test in a trial: how identity merges anonymous and logged-in people, how far back retention goes, how funnels count, whether you can jump from a funnel step to real sessions, and what unit the bill is based on. In the sample below, one funnel is 28% or 21% depending on a setting, and the same traffic costs $140 or $600 depending on the pricing unit.
What you will learn
- Fail any tool that cannot pass the identity test: every other chart depends on how people are counted
- Run one funnel with a known answer to see which counting setting to standardise on
- Estimate the bill under three traffic scenarios; the unit you grow fastest should not be the unit you are billed on
What counts as a product analytics tool?
A product analytics tool records what identified people do inside a product, as named events with properties, and answers funnel, retention and path questions from those events. That separates it from a web analytics tool, which is built around pages, sessions and traffic sources. The two overlap more every year, so the useful question is not "which category is this?" but "which of my questions does it answer, and what will it cost when my traffic doubles?" The definition and the metrics themselves are covered in what product analytics is; this guide is about comparing tools before you pick one.
Compare on five things that decide whether the tool will still work in a year: how it handles identity, how far back retention goes, how it counts funnels, whether it can show you a session when a number surprises you, and what unit the bill is based on.
Which kinds of tool are there?
Most tools you will see fit one of five shapes. Real products mix them, so judge by the strongest shape, not the marketing page.
| Type | Best at | Watch for |
|---|---|---|
| Event-based product analytics | Funnels, retention, paths and segments on named events | Needs a tracking plan; messy event names make every chart wrong |
| Web analytics with events | Traffic, sources and page conversion, with some custom events | Weak user-level history and identity; limits on how long user data is kept |
| Session replay and heatmaps | Seeing why a step fails | Not a counting tool; privacy masking and sampling matter |
| Warehouse or SQL-first | Joining product, billing and CRM data | Slower to first chart; someone must own the models |
| Suites that bundle several of the above | One vendor, one login | Shallow in at least one area; check the area you care about |
If you only need traffic and goal conversion, you may not need product analytics at all; funnel analytics tools covers the narrower case.
What should you compare on a feature matrix?
Use the table as a checklist during a trial. Each row has a test you can run with a handful of real events, so you are comparing behaviour, not feature names.
| Dimension | What to check | Test to run in a trial | Red flag |
|---|---|---|---|
| Identity | Anonymous-to-identified merge, device and account handling, ID changes | Browse logged out, log in on the same device, then on a second device; count the people | One person counted as two, or logout and login on a shared device merges two users |
| Retention | Cohort definition (N-day or unbounded), history length, segment filters | Build a 12-week cohort for one segment | History capped below your longest cycle; no way to filter by segment |
| Funnels | Conversion window, strict or any order, counting per user or per session | Recreate one funnel you know the answer to | Result changes by more than a few points depending on a setting you cannot see |
| Session replay | Masking, sampling, link from a funnel step to sessions | Jump from a drop-off step to ten example sessions | Replay in a separate tool with no shared user ID |
| Pricing basis | Events, monthly tracked users, replays, seats | Estimate next quarter's bill under three traffic scenarios | The unit you grow fastest is the unit you are billed on |
The next sections go through the rows that surprise people most.
| Dimension | Test to run in a trial | Red flag |
|---|---|---|
| Identity | Browse logged out, log in, then log in on a second device; count the people | One person counted twice, or two users merged on a shared device |
| Retention | Build a 12-week cohort for one segment | History shorter than your longest cycle |
| Funnels | Recreate a funnel whose answer you know | Result swings with a setting you cannot see |
| Session replay | Jump from a drop-off step to ten sessions | Replay in another tool with no shared user ID |
| Pricing basis | Estimate three traffic scenarios | Billed on the unit you grow fastest |
Each row can be tested with 15 to 20 real events in about two weeks.
Why does identity decide whether the numbers are right?
Identity decides how many people you count. Every product has an anonymous period (before login) and an identified one (after), and the tool has to stitch them together. One vendor's identity documentation shows how many details hide in that stitch: the merge happens only when an event carries both the device ID and the user ID, prior events are re-attributed retroactively, two user IDs cannot be merged and a user ID cannot be changed, a user identified by an email address becomes a new user if the email changes, and the mapping can take up to 24 hours to propagate, so a real-time funnel can briefly show false drop-offs.
Turn that into three trial checks:
- Log in, log out, log in as someone else on the same device. The two people must not merge.
- Change the identifier the tool uses (an email, say). Does the person survive? If the identifier is a changeable field, plan to use a stable internal ID instead.
- Look at the first day after launch. If a funnel looks worse than the same funnel a day later, you are seeing propagation, not behaviour.
How far back does retention go?
Retention answers a question that only a long history can answer: do people who started in week 1 still use the product in week 12? It fails quietly when the tool shortens history. Google's analytics data retention documentation shows one common pattern: user-level and event-level data can be kept for 2 or 14 months, and the setting affects explorations and funnel reports while standard aggregated reports are unaffected. A product with an annual contract cycle cannot answer a 12-month renewal question from user-level data kept 2 months.
Check three things in a trial: the longest history available for user-level analysis, whether "retained" means "came back on day N" or "came back on or after day N", and whether you can filter the cohort by plan or acquisition source. The answer to the second changes the curve: unbounded retention can only go up from day N, while day-N retention can bounce.
Do two tools count the same funnel the same way?
Not unless you set them the same way. Three settings change a funnel: the conversion window (how long between step 1 and the last step), whether steps must happen in order, and whether you count people or sessions.
Sample data: 1,000 people start a checkout, across 1,600 sessions. Within seven days, 280 of those people complete it. Counting people within a 7-day window: 280 ÷ 1,000 = 28.0%. Counting sessions that complete within the same session: say 336 of the 1,600 sessions finish, which is 336 ÷ 1,600 = 21.0%. The same data gives 28% or 21% depending on the setting, a 7-point gap with no change in behaviour.
So run one funnel whose answer you already know (from billing, for example) and see which setting reproduces it. That is the one to standardise on, and it belongs in your tracking plan.
Do you need session replay in the same tool?
Only if the question after a funnel is "why?". A funnel tells you most people leave at the address step; it cannot tell you the field rejects spaces. Replay and heatmaps tell you that, at the price of more data and a privacy review.
Rule: if you cannot jump from a funnel step to ten example sessions for the people who dropped there, replay will not be used. It lives in another tool and nobody opens it. Check masking (input fields masked by default), sampling (what share of sessions is recorded) and retention for recordings.
What unit is the price based on?
Pricing is where two tools with similar features diverge by multiples. The unit matters more than the price: one vendor's public pricing page, checked 2026-11-20, counts events on its free plan and lists a monthly tracked user (MTU) cap on a paid plan, where it defines an MTU as a unique user who triggers one or more events in a calendar month. Other tools bill per replay, per seat, or by data volume.
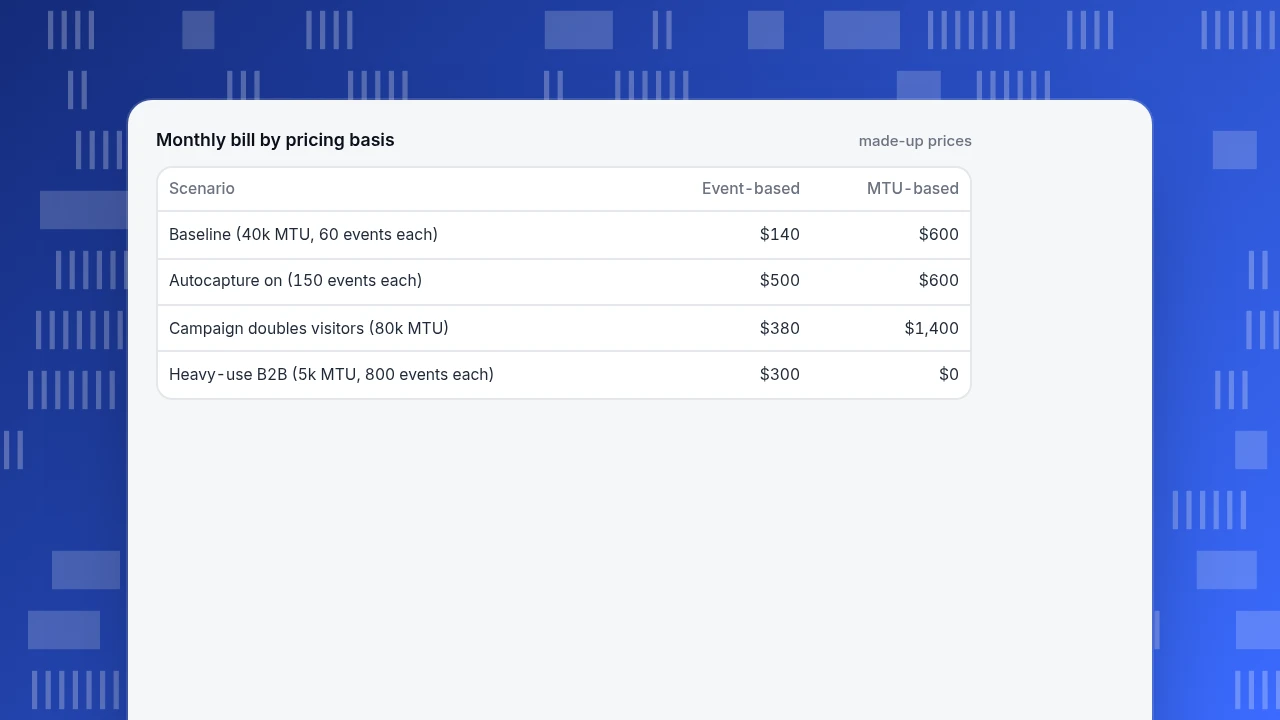
Sample data with made-up prices (not any vendor's): an event-based plan costs $0.0001 per event after 1 million free events, and an MTU-based plan costs $0.02 per user after 10,000 free users.
| Scenario | MTU | Events per user | Events | Event-based bill | MTU-based bill |
|---|---|---|---|---|---|
| Baseline | 40,000 | 60 | 2,400,000 | $140 | $600 |
| Autocapture turned on | 40,000 | 150 | 6,000,000 | $500 | $600 |
| Campaign doubles visitors | 80,000 | 60 | 4,800,000 | $380 | $1,400 |
| Heavy-use B2B product | 5,000 | 800 | 4,000,000 | $300 | $0 |
Recompute: 2.4M − 1M = 1.4M × $0.0001 = $140; (40,000 − 10,000) × $0.02 = $600. Autocapture multiplies the event bill by 3.6 (140 to 500) and leaves the MTU bill unchanged. A campaign multiplies the MTU bill by 2.3 (600 to 1,400). A small base of heavy users is free on one basis and $300 on the other. Neither unit is better; pick the one that grows slowest for your product, and estimate three scenarios before you sign.
Monthly bill by pricing basis
made-up prices| Scenario | Event-based | MTU-based |
|---|---|---|
| Baseline (40k MTU, 60 events each) | $140 | $600 |
| Autocapture on (150 events each) | $500 | $600 |
| Campaign doubles visitors (80k MTU) | $380 | $1,400 |
| Heavy-use B2B (5k MTU, 800 events each) | $300 | $0 |
How do you run a two-week trial?
A short, scripted trial beats a feature comparison.
- Pick three questions you must answer (for example: where do new users drop in onboarding, which plan retains best, which feature precedes upgrades).
- Send the same 15 to 20 events to each tool from a real environment, using stable IDs.
- Run the identity, retention and funnel tests from the matrix and record any difference.
- Estimate the bill under the three pricing scenarios.
- Check the exit. Can you export raw events? If not, your history is a hostage.
Score each test pass or fail, and drop any tool that fails the identity test; every other chart depends on it.
How does this look in TapCub?
Take the same checklist and run it on TapCub, which puts website, app and mini-program events in one project.
- Identity. Anonymous visitors are counted, and after login with
tapcub.loginthe person appears in All-platform analytics › Users › People with a day-by-day timeline of behaviour. Anonymous visitors have no profile and do not enter segments. For B2B,tapcub.group('company', 'acme', {...})rolls people up into accounts in All-platform analytics › Users › Accounts; the accounts view is organisation-level and cannot open personal detail. - Retention and funnels. Build both in All-platform analytics › Behavior › Behavior analysis, which also holds paths, distribution, lifecycle and attribution. Lifecycle shows New, Returning, Resurrecting and Dormant. A segment defined in All-platform analytics › Users › Segments & tags can be reused as a group in funnels and retention.
- Why a step fails. All-platform analytics › Behavior › Heatmaps shows clicks, rage clicks, scroll and elements; Session replay is off by default and has to be switched on.
- Custom metrics. All-platform analytics › Behavior › Metrics & SQL lets you define a metric by formula or run a query on event data.
- What it does not do. TapCub does not run A/B tests or feature flags, send surveys, or show in-product prompts; it only measures. Check its pricing page for the billing unit rather than assuming it from this article.
FAQ
What are product analytics tools?
They record what identified users do inside a product as named events, then answer funnel, retention, path and segment questions. They differ from web analytics tools, which centre on pages, sessions and traffic sources; the two overlap, so test the questions you need rather than trusting the category.
What is the difference between product analytics and web analytics?
Web analytics asks how many people arrived and from where; product analytics asks what identified people did next and whether they returned. A product with a login needs the second; a marketing site may only need the first.
Which product analytics features matter most?
Identity handling, retention history, funnel counting rules, a path from a funnel step to example sessions and the pricing unit. A tool that fails the identity test miscounts every other chart.
Are there free product analytics tools?
Yes, but compare the unit, not the headline. A free plan counted in events will run out on autocapture; one counted in users runs out when a campaign lands. Run the three scenarios before relying on a free tier.
How long should I trial a tool?
About two weeks, with the same 15 to 20 events sent to each tool, so you can compare identity, retention and funnel results on the same behaviour.
See also: Product Analytics: What It Is, Key Metrics and How to Start.
Sources
- Mixpanel. Identifying users (simplified identity merge) — merge rules, 24-hour propagation, ID limits. Verified 2026-11-20.
- Google. Data retention in Google Analytics — 2 or 14 months for user-level and event-level data; standard reports unaffected. Verified 2026-11-20.
- Amplitude. Pricing — events on the free plan, MTU cap on a paid plan, MTU definition. Verified 2026-11-20; vendor plans change.
Was this article helpful?
We use your answers to fix and expand this page.
Couldn’t send. Please try again in a minute.
Thanks for the feedback. We’ll use it to improve this page.You’ve already sent feedback on this page. Thanks.

Customer Experience Consultant
Writes about live chat, visitor conversations, and self-service, sharing practical ways to make customer communication clearer and more effective.