Try it on your own data
Every report in this article is in the free plan. One snippet for web and apps, up to 10 sites.
Start freeProduct differentiation examples are easiest to learn from when sorted by type: price, feature, experience or niche. Across ten companies with public filings, the difference showed up in a ratio (renewal rate, net dollar retention, segment margin) rather than in headline revenue, and it did not guarantee growth.
What you will learn
- Sort differentiation by price, feature, experience or niche, then look for the one ratio that should move for that type
- In ten filed cases the difference showed in renewal, retention or margin; Ryanair, Etsy and Peloton show it does not guarantee growth
- Test your own claim on retention and conversion together; in our sample the best-converting claim kept the fewest customers
How do you sort product differentiation examples?
Product differentiation means giving buyers a reason to choose your product over alternatives that do roughly the same job. Examples are easier to learn from once they are sorted by what is different, because each type shows up in different numbers:
- Price: the same job done at a visibly lower cost, usually because the business model, not a discount, makes it possible.
- Feature: a capability alternatives lack, or have in a clumsier form.
- Experience: the way buying, using or owning the product feels, including the service around it.
- Niche: a product built for one audience's specific needs rather than for everyone.
This guide takes ten companies that publish audited or filed numbers, assigns each to the closest type, and reads what the public figures do and do not prove. We assigned the types ourselves; none of the companies describes itself this way, and several fit two types. The point is the numbers you would look for in your own product, not a ranking of firms. For the competitive side of the question (who you are actually compared with), see direct vs indirect competitors.
Which ten companies, and what do their public numbers show?
Every figure below comes from the company's own filing or results release, linked in Sources. Years are fiscal years as the company defines them.
| Company | Type | What is different | Public outcome |
|---|---|---|---|
| Costco | Price | Membership-fee warehouse model | FY2025 membership fees $5,323m, up from $4,828m; renewal 92.3% US/Canada, 89.8% worldwide |
| Ryanair | Price | Low average fares | FY25 traffic up 9% to a record 200 million with average fare down 7%; profit after tax €1.61bn versus €1.92bn |
| Duolingo | Feature | Gamified daily practice with a free tier | Q3 2025: 50.5M daily users (+36%), 11.5M paid subscribers, revenue $271.7M (+41%) |
| Figma | Feature | Real-time collaborative design in the browser | FY2025 revenue $1,055.8M (+41%); net dollar retention 136%; 1,405 customers above $100k ARR |
| Spotify | Feature | Free ad-supported tier plus paid Premium | Q3 2025: 713M monthly users (+11%), 281M subscribers (+12%) |
| Warby Parker | Experience | Eyewear sold online and in its own stores | 2024 net revenue $771.3M (+15.2%); 2.51M active customers; 276 stores; $307 revenue per customer |
| Apple | Experience | Integrated hardware, software and services | FY2025 net sales $416.2bn; Services $109.2bn at 75.4% gross margin versus 36.8% for Products |
| Peloton | Experience | Connected hardware plus content subscription | FY25 revenue $2,490.8M versus $2,700.5M; paid connected-fitness subscriptions 2.800M versus 2.976M |
| Veeva | Niche | Cloud software for life sciences | FY2025 revenue $2,746.6M (+16%); operating income $691.4M (25.2% margin); 1,477 customers |
| Etsy | Niche | Marketplace for handmade, vintage and craft goods | 2024 GMS $12.59bn (−4.4%); revenue $2.81bn (+2.2%); 95.5M active buyers; 8.1M sellers |
Two things stand out before any analysis. Differentiation did not guarantee growth: Ryanair's profit fell while traffic rose, Etsy's sales shrank, Peloton's revenue and subscriptions fell. And the strongest-looking numbers are not all revenue numbers: they are retention, margin and engagement.
What do the price examples teach?
Costco charges a fee before you can buy anything, and the filing shows what that buys: membership fees rose 10% to $5,323 million in fiscal 2025, and 92.3% of US and Canadian members renewed. The company points out that renewal dipped from 92.9% (US and Canada) and from 90.5% worldwide a year earlier, which it attributes to more online sign-ups entering the calculation, since those members renew at a slightly lower rate. About 40% of the membership income growth came from the fee increase that took effect on September 1, 2024. Lesson: a price-led advantage shows up as retention, not just volume. If people keep paying to stay, the low price is doing its job.
Ryanair shows the other edge. In the year to March 2025 it carried a record 200 million passengers, 9% more than the year before, while the average fare fell 7%. Revenue rose 4% to €13.95bn, but profit after tax fell from €1.92bn to €1.61bn, an 11.5% margin on revenue. Lesson: a price advantage is a bet that volume outruns margin; check both sides before copying it. A price difference is also the easiest one for rivals to copy, so it needs a cost structure behind it.
What do the feature examples teach?
Duolingo turns practice into a daily habit. Its Q3 2025 letter reports 50.5 million daily and 135.3 million monthly active users, so about 37% of monthly users show up on a given day (50.5 ÷ 135.3). Paid subscribers were 11.5 million, or 8.5% of monthly users. Revenue grew 41% to $271.7 million. The letters do not attribute that growth to any single feature, so read the gamification as a plausible driver, not a proven one.
Figma replaced file-passing with shared editing in the browser. Its fiscal 2025 revenue was $1,055.8 million, up 41%, and net dollar retention was 136% at December 31, 2025, which means customers who were with it a year earlier now pay 36% more in total. A feature advantage that customers pay more for over time is the clearest signal in the table.
Spotify bundles a free ad-supported tier with paid Premium. In Q3 2025 it reported 713 million monthly users and 281 million subscribers, so 39.4% of users pay (281 ÷ 713). Lesson: with a free tier, the useful number is the share that converts, not the user count alone.
What do the experience examples teach?
Warby Parker sells eyewear online and through its own stores. In 2024 net revenue was $771.3 million, up 15.2%, from 2.51 million active customers; dividing gives $307 per customer, matching the figure it reports. It opened 41 stores in the year and ended with 276. The store count is the experience investment; the revenue per customer is its yardstick.
Apple shows what an integrated experience does to margin. Of $416.2 billion in fiscal 2025 net sales, Services were $109.2 billion, or 26.2%, with a 75.4% gross margin, against 36.8% for Products and 46.9% overall. The experience around the device is where the margin is.
Peloton is the caution. Its fiscal 2025 revenue was $2,490.8 million against $2,700.5 million the year before (−7.8%), and ending paid connected-fitness subscriptions fell from 2.976 million to 2.800 million (−5.9%). A strong experience does not protect a business when the category or the price point shifts. The company reports a revised subscription data model from January 2025, so treat the subscription comparison as indicative.
What do the niche examples teach?
Veeva builds software for life sciences companies only. For fiscal 2025 (year ended January 31, 2025) it reported $2,746.6 million revenue, up 16%, and operating income of $691.4 million, a 25.2% operating margin, with 1,477 customers. Few customers, high margin: a niche pays when the buyers are few but each is worth a lot.
Etsy focuses on handmade and vintage goods, but a niche can stop growing. In 2024 its consolidated gross merchandise sales fell 4.4% to $12.59 billion, while revenue rose 2.2% to $2.81 billion, so revenue was 22.3% of sales (2,808 ÷ 12,587). Lesson: a clear niche gives you a loyal base, but it does not guarantee the base keeps expanding; watch active buyers and sales per buyer, not only revenue.
What do the ten cases have in common?
Recomputing the ratios from the table, using the filings' own numbers:
| Ratio | Calculation | Result |
|---|---|---|
| Duolingo daily-to-monthly users | 50.5 ÷ 135.3 | 37.3% |
| Duolingo paid share of monthly users | 11.5 ÷ 135.3 | 8.5% |
| Spotify paid share of monthly users | 281 ÷ 713 | 39.4% |
| Apple Services share of net sales | 109,158 ÷ 416,161 | 26.2% |
| Veeva operating margin | 691.4 ÷ 2,746.6 | 25.2% |
| Ryanair profit margin | 1.61 ÷ 13.95 | 11.5% |
| Etsy revenue as share of sales | 2,808 ÷ 12,587 | 22.3% |
| Peloton revenue change | 2,490.8 ÷ 2,700.5 − 1 | −7.8% |
The pattern is that each company's differentiation is visible in a ratio, not a headline: renewal rate for Costco, net dollar retention for Figma, services margin for Apple, operating margin for Veeva. Headline revenue moves for many reasons; ratios tell you whether the difference is being paid for. Keep one caution in mind: these are correlations from public filings. We cannot show that the differentiator caused the number, and companies that failed to differentiate are underrepresented in any list of examples.
| Type | Ratio to watch | Example from the cases |
|---|---|---|
| Price | Renewal or repeat purchase | Costco: 92.3% US and Canada renewal |
| Feature | Net dollar retention or feature usage | Figma: 136% net dollar retention |
| Experience | Margin by segment or revenue per customer | Apple: Services 75.4% vs Products 36.8% |
| Niche | Operating margin | Veeva: 25.2% operating margin |
Figures from each company's filing, fiscal years as defined by the company.
How do you test whether your own differentiator works?
Turn the lesson into a procedure you can run in a quarter:
- State the difference as a claim a buyer would repeat. "Cheaper" or "built for clinics" is a claim. "Better quality" is not.
- Pick the ratio that should move. Price claim: repeat purchase or renewal. Feature claim: share of users who use the feature, and retention of those who do. Experience claim: revenue per customer. Niche claim: conversion on traffic that matches the niche.
- Show the claim to different groups. Run one campaign per claim, each pointing to a page that leads with that claim, with its own UTM content tag.
- Compare on the ratio, not on clicks. A claim that attracts clicks but not conversions or retention is not a differentiator.
- Set a decision rule in advance. For example: keep the claim if its conversion is above the page average and its 30-day retention is not lower.
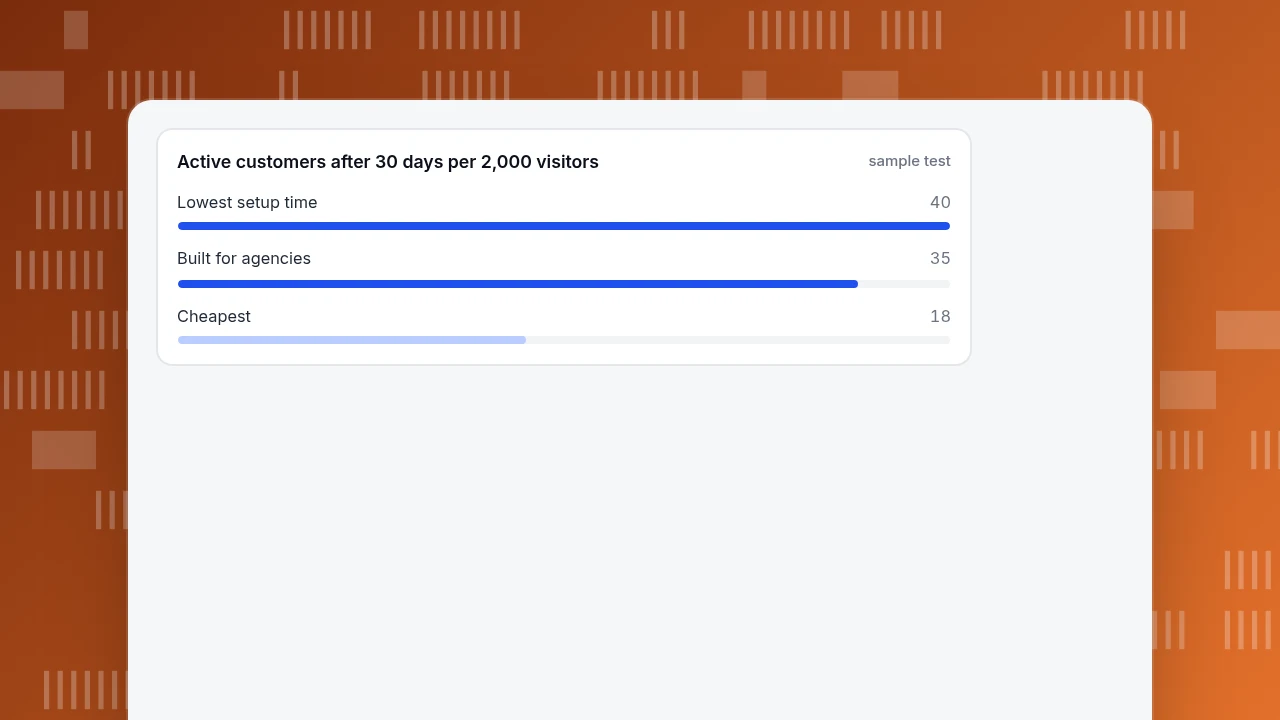
Sample data: three claims each get 2,000 visitors. "Lowest setup time" converts 5.0% (100 signups), "Built for agencies" 3.5% (70), "Cheapest" 6.0% (120). On conversion alone "Cheapest" wins. After 30 days 40% of the "Lowest setup time" signups are still active (40 people), 50% of "Built for agencies" (35), and 15% of "Cheapest" (18). Counting active customers per 2,000 visitors, the ranking becomes "Lowest setup time" 40, "Built for agencies" 35, "Cheapest" 18. The claim that converts best is not the one that keeps customers, which is why step 4 uses the ratio.
Active customers after 30 days per 2,000 visitors
sample testHow to test a differentiator in TapCub
Here is how a team would run the claim test above. TapCub measures; it does not run price research, competitor tracking or split tests.
- Tag each claim campaign. Give every ad, email or post a UTM content value per claim (for example
utm_content=claim_setup_time). Web analytics › Sources has a UTM tab that splits source, medium, campaign, term and content. - Mark the conversion as a goal. In Web analytics › Goals, set signup or purchase as the goal so each source row shows conversions. Bots are counted separately, so crawlers do not dilute the rates.
- Compare conversion per claim. In the UTM view compare visitors and conversions by content value, as in the 2,000-visitor example. TapCub does not split traffic for you, so route each claim to its own landing page or its own campaign.
- Check who stays. In All-platform analytics › Behavior › Behavior analysis open retention and compare the people who arrived from each claim, using a saved segment under All-platform analytics › Users › Segments & tags where it helps. Identify logged-in users with
tapcub.loginso the profile follows the person. - Decide on the ratio. Apply your pre-set rule: keep the claim only if conversion and 30-day retention both hold up. Anything TapCub cannot see, such as price changes at competitors, stays in your own research.
FAQ
What are examples of product differentiation?
Costco and Ryanair differentiate on price, Duolingo, Figma and Spotify on features, Warby Parker, Apple and Peloton on experience, and Veeva and Etsy on a niche audience. Each company's public filings show a different payoff: renewal rate, net dollar retention, margin by segment or revenue per customer.
What are the four types of product differentiation?
The common groupings are price, feature, experience and niche. They overlap: Apple is an experience play with a margin story, and Spotify mixes a free tier with a paid one. Classify by the claim a buyer would repeat, then pick the ratio that should move.
Does differentiation always lead to growth?
No. In the ten cases here, Ryanair's profit fell while traffic rose, Etsy's sales fell 4.4% in 2024 and Peloton's revenue fell 7.8% in fiscal 2025. Differentiation gives buyers a reason to choose you; growth also depends on category demand, cost structure and how easily rivals copy you.
How do you measure whether a differentiator works?
Measure the ratio the claim should move, not the traffic it attracts: renewal for price, feature usage and retention for features, revenue per customer for experience, conversion on matching traffic for a niche. Compare claims on the same ratio over the same period, and decide the rule before you look at results.
Which metric shows differentiation best?
No single metric does. Retention-type numbers (Costco's renewal rate, Figma's 136% net dollar retention) show customers keep choosing you, while margin by segment (Apple Services 75.4% against 36.8% for Products) shows the difference is paid for. Choose the one tied to your claim.
Sources
- Costco Wholesale. Form 10-K for fiscal 2025 — membership fees, renewal rates, fee increase share. Checked 2026-11-20.
- Ryanair. FY25 results release, 19 May 2025 — traffic, fares, revenue, profit after tax.
- Duolingo. Q3 2025 shareholder letter, November 5, 2025 — daily and monthly users, subscribers, revenue.
- Figma. Fourth quarter and fiscal year 2025 results, February 18, 2026 — revenue and net dollar retention.
- Spotify. Q3 2025 earnings, November 4, 2025 — monthly users and subscribers.
- Warby Parker. Q4 and full year 2024 results, February 27, 2025 — revenue, customers, stores.
- Apple. Form 10-K for fiscal 2025 — net sales and gross margin by Products and Services.
- Peloton. Q4 fiscal 2025 shareholder letter, August 7, 2025 — revenue and subscriptions.
- Veeva Systems. Fourth quarter and fiscal 2025 results, March 5, 2025.
- Etsy. Fourth quarter and full year 2024 results, February 19, 2025.
Was this article helpful?
We use your answers to fix and expand this page.
Couldn’t send. Please try again in a minute.
Thanks for the feedback. We’ll use it to improve this page.You’ve already sent feedback on this page. Thanks.

Product Experience Specialist
Writes about product experience, practical workflows, and growth, turning complex processes into clear steps for everyday decisions.