Try it on your own data
Every report in this article is in the free plan. One snippet for web and apps, up to 10 sites.
Start freeOmnichannel analytics means reading web, app and mini-program data as one person-level journey — and its hard part is connecting the same person, not building more reports. This guide gives the dedup arithmetic, a fully worked cross-channel example with four attribution models, the identity and event plumbing, and the limits.
What you will learn
- Per-platform reports double-count people: 1,000 web-first plus 300 app users sums to 1,300, a 30.0% overcount, and split one journey into a fake web 0% vs app 40.0%.
- Connect identity first — an anonymous ID per platform, merge at login with tapcub.login, read one person-level profile; anonymous visitors cannot be merged cross-platform.
- Read attribution models side by side: on the example's two-touchpoint journeys first-touch credits web 120, last-touch app 120, linear and position 60 / 60 — so do not cut a channel on last-click.
What is omnichannel analytics?
Omnichannel analytics reads data from every channel and device — website, app, mini-program, email, in-store — as one person-level journey, not separate per-channel reports. The goal is a single customer view: what one person did across all touchpoints, and which drove the outcome. Matomo's guide frames it as combining online and offline interactions into a unified customer view; ThoughtSpot calls it journey measurement, not "more dashboards."
The practical test: if your "omnichannel" dashboard still counts the same person on web and again on app, it is multichannel reporting with a shared logo. Cross-channel joins touchpoints into a journey; omnichannel resolves them to one identity and one event model — Adobe's Customer Journey Analytics doc calls this person-level, not device- or cookie-level, stitching. For the campaign and ad-buying side, see cross-channel marketing.
| Approach | Data scope | Identity level | Question it answers |
|---|---|---|---|
| Multichannel | A separate report per channel | None shared — the same person counted again on each platform | How did each channel do on its own? |
| Cross-channel | Touchpoints joined into a journey | Often device- or session-level | How do channels hand off to each other? |
| Omnichannel | One event model across all channels | One resolved person | What did this person do across everything, and what drove the outcome? |
Distinction drawn from Matomo's omnichannel guide, Twilio's multichannel-vs-omnichannel section and Adobe CJA's person-level stitching consideration.
Why channel-by-channel reports mislead
Per-platform dashboards double-count people and hide the journey. Two arithmetic problems show why (sample data).
The dedup problem. Say 1,000 people first arrive on your website. Later, 300 of those same people also use your app. Add the platform "user" counts: 1,000 + 300 = 1,300. But there are only 1,000 real people. The raw sum overcounts by 300 — a 30.0% inflation (300 ÷ 1,000). Every metric on that denominator, from cost per user to reach, is wrong by that margin.
The conversion illusion. Suppose 120 of those people place their first order in the app within 30 days. Read each platform alone:
- Web: 0 orders ÷ 1,000 visitors = 0% conversion.
- App: 120 orders ÷ 300 users = 40.0% conversion.
The dashboard says "the app converts, the web is worthless" — an artefact of splitting one person into two rows. The web visit and the app order are one journey; the web session started 120 of those orders. Stitch identity first and the web's contribution appears. The difficulty is the same person missing from the reports, not the reports themselves.
How to connect the same person across web, app and mini-program
Identity resolution turns multichannel rows into one person. The deterministic rule has three steps:
- Anonymous ID per platform. Before login, each device and platform gets its own anonymous visitor ID. A web cookie and an app install ID are not the same person yet.
- Merge at sign-in. At sign-in, call
tapcub.loginon web and app with the same user ID; both anonymous IDs now tie to one known person. Google Analytics 4's User-ID doc describes the same mechanism: a signed-in ID associates one person across devices and platforms. - Read the merged profile. The person now has one day-by-day timeline across platforms; segments and funnels operate on people, not devices.
The anonymous boundary. If a visitor never logs in, you cannot deterministically merge them across platforms — only within a platform. Adobe CJA's stitching note is explicit: person-level resolution needs a shared persistent ID, not transient device IDs. In TapCub, anonymous visitors have no profile and do not enter segments. See identity resolution, identify users and cross-device merge.
How to make events comparable across platforms
Shared identity is necessary but not sufficient: if "purchase" means different things on web and app, the unified view is nonsense. Three rules.
One event dictionary. Define each event once, with a platform field, and reuse it everywhere:
| Event name | Platform | Trigger | Required property |
|---|---|---|---|
web_visit | web | Landing page loads | source, landing_page |
app_open | ios / android | App foregrounded | user_id (if logged in) |
purchase | web / ios / android / mp / server | Order confirmed | order_id, value, currency |
purchase keeps the same name and required properties on every platform, including a server row for backend or offline orders — the unified data model payoff.
One timezone. Pick one project timezone so day boundaries line up; otherwise a 23:50 web visit and a 00:10 app order land in different days and daily joins break.
Offline and backend channels as events. In-store pickups, call-centre orders and POS sales have no SDK. Send them as server HTTP events (or import logs) with the same names and a user ID when known; offline channels enter only as events.
Checklist before you trust a cross-channel report:
- Same event names and required properties on every platform.
- One project timezone for all platforms.
- Login fires
tapcub.loginon web and app. - Offline and backend orders sent as server events, with a user ID where known.
Worked example: web-first visitors who order in the app
Full arithmetic, recomputable end to end (sample data).
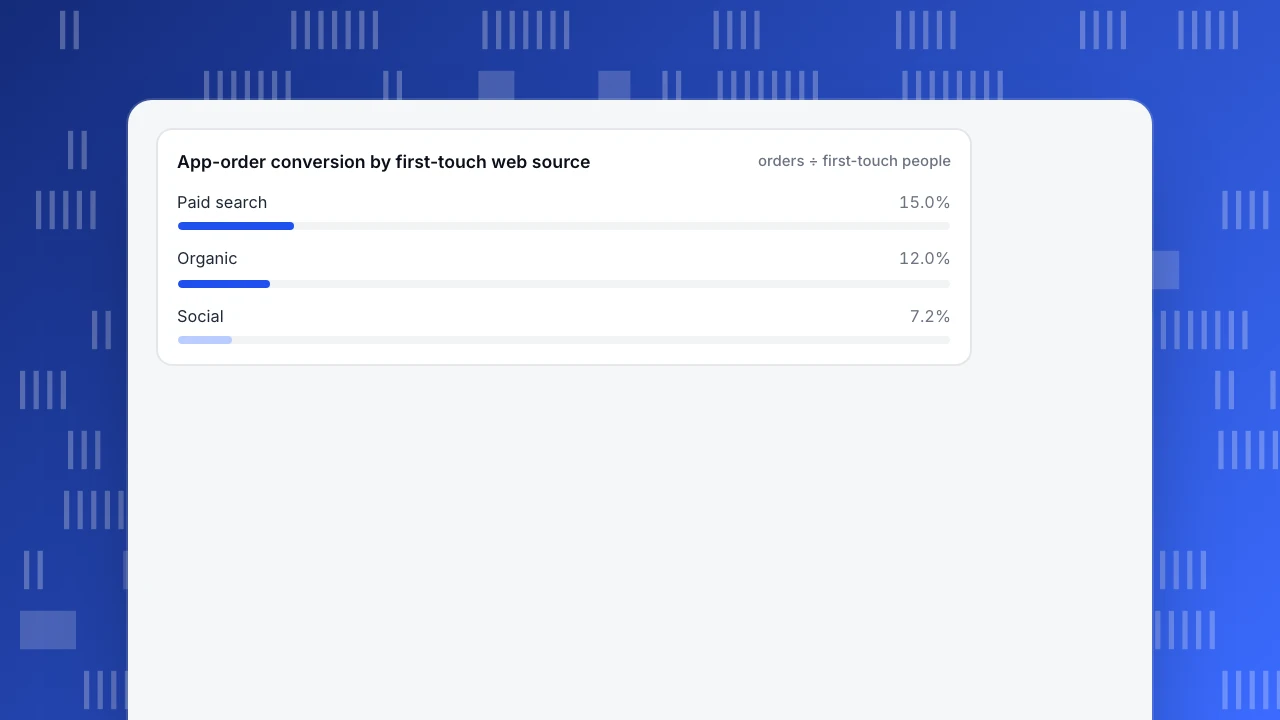
The cohort. 1,000 people first arrive on the web, by first-touch source: paid search 400, organic 350, social 250 (400 + 350 + 250 = 1,000). Of these, 300 later use the app, and within 30 days 120 place their first order there. By first-touch web source those 120 orders split 60 / 42 / 18 (60 + 42 + 18 = 120).
Conversion by first-touch source (orders ÷ people who started on that source):
- Paid search: 60 ÷ 400 = 15.0%.
- Organic: 42 ÷ 350 = 12.0%.
- Social: 18 ÷ 250 = 7.2%.
Unstitched, the web showed 0% and the app 40.0% (120 ÷ 300). Stitched, the web sources carry real conversion — and social, the lowest-converting source, still started 18 orders that the app-only view credits to nobody on the web.
Four attribution models on the same journeys. Each of the 120 orders has a two-touchpoint journey: a web session, then the app order.
| Model | Web source credit | App credit | Rule on 2 touchpoints |
|---|---|---|---|
| First-touch | 120 (60 / 42 / 18) | 0 | All credit to the first touch |
| Last-touch | 0 | 120 | All credit to the last touch |
| Linear | 60 | 60 | Split evenly (50 / 50) |
| Position | 60 | 60 | 2 touches → 50 / 50, so linear = position here |
With two touchpoints, linear and position give the same 60 / 60 split; they diverge at three or more, when position weights first and last at 40% each and the middle 20%. Time-decay gives the app slightly more than 60, sitting closer to the order.
Decision rules. Do not cut social on a last-click report — it assisted 18 orders that last-click hides. The lookback window bounds this: at 30 days (including the converting session), an order on day 31 gets no credit. Read first-touch and last-touch side by side; the gap is the assist value a single model throws away. See attribution.
App-order conversion by first-touch web source
orders ÷ first-touch peopleWhich questions and metrics omnichannel analytics answers
Once identity and events are unified, measure journeys, not platforms. Core KPIs:
| Metric | Formula | What it tells you |
|---|---|---|
| Journey conversion by source | Orders ÷ first-touch people on that source | Which channel starts converting journeys (15.0% / 12.0% / 7.2% above) |
| Cross-device rate | Merged people ÷ total people | How much of your audience you can see end-to-end |
| Chat-assisted conversion | Chatted-then-goal rate vs browsed-only rate | Whether live chat moves the outcome |
| Channel ROI | Spend ÷ orders, or revenue ÷ spend | What each channel costs per outcome |
The small-sample rule. For chat-assisted conversion, if fewer than 30 people chatted, treat the lift as directional, not a result. The same caution applies to any thin denominator: social's 7.2% rests on 250 people and 18 orders, so watch the trend before reallocating budget.
For B2B journeys with long cycles and several stakeholders, the same logic extends to accounts — see B2B marketing attribution.
Limits: what omnichannel analytics can't do
The boundaries, as decision rules:
- Not click-to-install attribution. If you need to match an ad click to an app install via postback, this is not that — it measures journeys, not installs. Use a dedicated attribution vendor.
- Offline only as events. If a channel cannot send an event (no SDK, no backend hook), it cannot enter the model; in-store data joins only as a server event with a user ID.
- Anonymous visitors stay separate. If a person never logs in, you cannot deterministically merge their web and app activity; plan identity coverage around login.
- The lookback window bounds credit. An order outside the window (default 30 days) gets no credit. A longer window captures more assists but blurs cause.
- Bots must leave the denominator. If crawlers and AI agents count as visitors, every conversion rate is understated. Keep them in a separate report.
- No experiments or ad buying. It measures; it does not run A/B tests, set bids, or score leads. For campaign execution, see cross-channel marketing.
How to do it in TapCub
Take the 1,000 web-first people from the example — 300 who also use the app, 120 who order there. In TapCub the order of work is the article's thesis: connect the person first, then compare.
- Put every platform in one project. Install the web script from Web analytics › Configuration › SDK code, add the iOS, Android or mini-program SDK, and send backend or in-store orders through the server HTTP interface. Website, app and mini program land in one project on one event and user model; offline channels enter only as events. Write
purchaseonce in All-platform analytics › Data › Tracking plan with its platforms and required properties, and check arrivals in All-platform analytics › Data › Data quality. - Merge at login. Call
tapcub.loginwith the same user ID on web and app; anonymous events from before login on that device are attached to the person. All-platform analytics › Users › People then shows one day-by-day timeline that merges the bound devices. Anonymous visitors who never log in stay unmerged. - Count people, not platform rows. All-platform analytics › Overview › Multi-platform overview counts people after identity resolution. Its Platform overlap chart shows the 300 who used both web and app, so the audience reads 1,000, not 1,300. The Identification rate chart shows the share of active users who are signed in per platform and suggests a fix below 5% on the website or 20% on the app — below that, the overlap is undercounted.
- See the journey that switched platform. The First platform → conversion platform matrix on the same page shows where new users first appeared and where they first ordered: the example's 120 orders sit in the web → app cell instead of reading as "app 40%, web 0%". Save that cell as a segment, or build a funnel in All-platform analytics › Behavior › Behavior analysis with each step's Platform picker set to web, then app.
- Split credit by source. In the same builder, attribution with the touch set to channel and first, last, linear, position and time decay selected together puts one column per model, so the paid search / organic / social split of the first touches sits next to last-touch credit (lookback 30 days by default, 1–90). Web analytics › Bots keeps crawlers and AI agents out of the visitor counts, so the 1,000 are real people.
Boundaries: anonymous visitors cannot be merged across platforms before login; offline channels join only as server events; TapCub receives install postbacks but is not a click-to-install attribution vendor; it runs no A/B tests, ad buying, CRM or lead scoring.
FAQ
What is the difference between multichannel and omnichannel analytics?
Multichannel analytics reports each channel separately with no shared identity, so the same person is counted again on every platform. Omnichannel analytics resolves those touchpoints to one person on one event model, so you can read a complete journey and see which channel drove the outcome. Cross-channel sits between: it joins touchpoints but often stays at device or session level.
Do I need a CDP to do omnichannel analytics?
Not necessarily. A customer data platform is one way to unify identities and events, but an analytics tool that collects web, app and mini-program data into one project on one user model can do the same job. What you need is a shared persistent ID at login and one event dictionary — not a specific product category.
How do I handle consent and privacy when combining online and offline data?
Combine data on a lawful basis and tell people what you collect. Where consent is required for analytics, honour it before identifying users, and offer an anonymous aggregate mode for visitors who decline. Tie offline imports to a user ID only when permitted, and apply retention and deletion rules across the unified profile.
Why do my channel reports double-count users?
Because each platform counts its own visitors and the same person appears on several. In the example, 1,000 web-first people plus 300 who also use the app sum to 1,300 "users" — a 30.0% overcount of the 1,000 real people. Deduplicate on a resolved person ID before computing reach, cost per user or conversion.
Can I stitch anonymous visitors across devices?
Not deterministically. Without a shared login ID, a web cookie and an app install ID are just two anonymous devices; you can join within a platform but not reliably across them. Login-based merging on a persistent user ID gives person-level resolution. Anonymous visitors typically have no profile and cannot enter segments.
Which attribution model fits a cross-channel journey?
Read several side by side rather than picking one. In the example's two-touchpoint journeys, first-touch credits the web source with all 120 orders, last-touch credits the app, and linear and position both split 60 / 60. That gap is the assist value a single model hides, so do not cut a channel on last-click alone. Connect the same person first; only then does the comparison mean anything.
See also: Omnichannel Engagement: What It Is and How to Measure It.
See also: Cross-Channel Campaign Management: One Identity, One Set of Definitions, One Rhythm.
Sources
- Matomo Core Team (2024-04-14). A Beginner's Guide to Omnichannel Analytics. Matomo.
- Adobe. Cross-channel analysis (Customer Journey Analytics). Adobe Experience League, updated 2026-10-09.
- Google. User-ID — GA4 developer guide. Google Developers.
- ThoughtSpot (2026-02-25). How to drive growth with retail omnichannel analytics. ThoughtSpot.
Was this article helpful?
We use your answers to fix and expand this page.
Couldn’t send. Please try again in a minute.
Thanks for the feedback. We’ll use it to improve this page.You’ve already sent feedback on this page. Thanks.

Technical Engineer
Focuses on tracking code, SDKs, and API integrations, with practical guidance on implementation checks and troubleshooting.