Try it on your own data
Every report in this article is in the free plan. One snippet for web and apps, up to 10 sites.
Start freeCross-channel campaign management is planning and running one campaign across several channels, with shared audience, message, timing and measurement. The hard part is three agreements: one identity, one set of definitions and one rhythm. In the worked example, three channel reports claim 470 orders when the store recorded 300, and the same paid social spend costs $66.67 or $300.00 per order depending on the attribution model.
What you will learn
- The hard part is three agreements — one identity, one set of definitions, one rhythm — not sending messages in three places
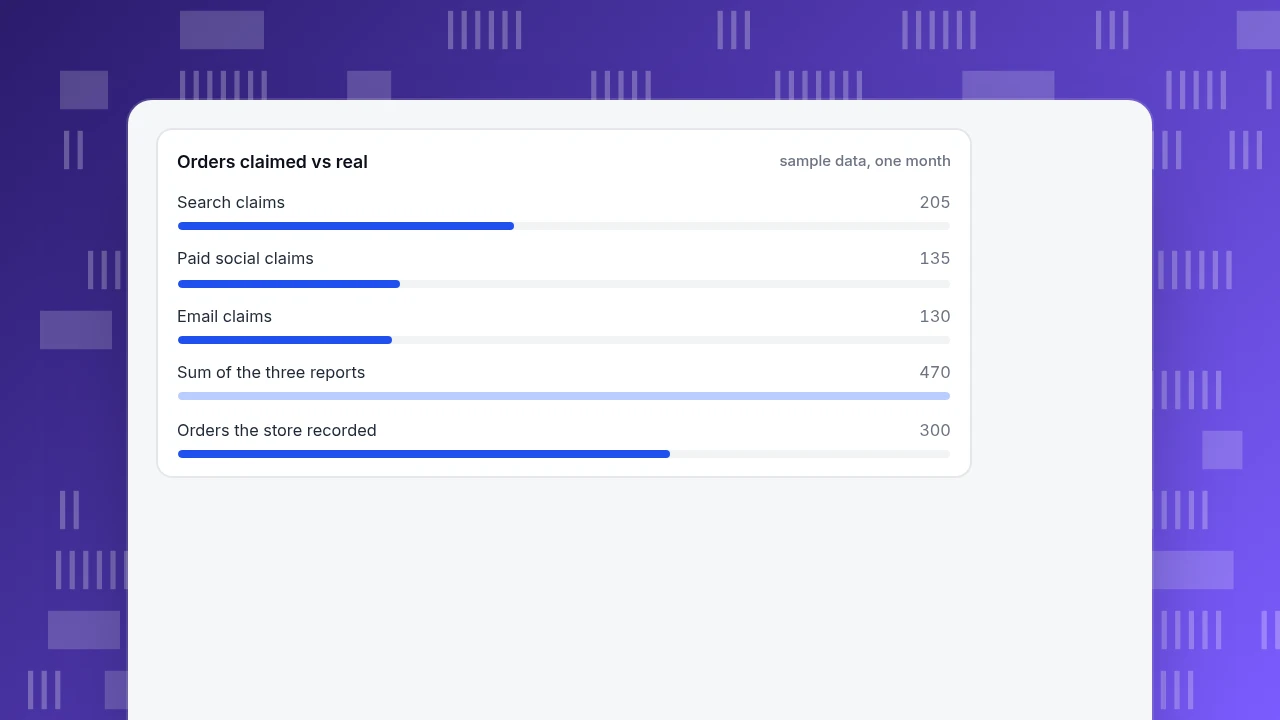
- Adding each channel's own report over-counts: 205 + 130 + 135 = 470 claimed orders against 300 real, 1.57 times too many
- Compare several attribution models: paid social costs $66.67 per order on first touch and $300.00 on last touch for the same spend
What is cross-channel campaign management?
Cross-channel campaign management is planning and running one campaign across several channels, such as email, paid social, search and your own site, so that the audience, message, timing and measurement are shared instead of each channel running on its own. The goal is that a person who sees the offer in an email and again in an ad meets one consistent campaign, and that you can count what the whole campaign achieved without counting the same customer three times.
It is easy to buy tools for this and still not do it. The hard part is not sending messages in three places; it is three agreements: one identity (who is this person across channels), one set of definitions (what counts as a conversion, a campaign, a channel) and one rhythm (who does what, when, and when we review). The rest of this guide takes each in turn, after a worked example of what goes wrong when they are missing.
What happens when each channel reports its own results? A worked example
Sample data: one campaign ran on three channels for a month. Each channel's own report claims every order its audience placed within its attribution window. The store's order system counts each order once.
First, the paths that 300 unique orders took (sample data, one row per path):
| Path (touches in order) | Orders |
|---|---|
| Search only | 90 |
| Email only | 40 |
| Paid social only | 30 |
| Paid social → Search | 50 |
| Paid social → Email | 25 |
| Email → Search | 35 |
| Paid social → Email → Search | 30 |
| Total | 300 |
Now count what each channel would claim if it takes credit for every order it touched:
- Search: 90 + 50 + 35 + 30 = 205
- Email: 40 + 25 + 35 + 30 = 130
- Paid social: 30 + 50 + 25 + 30 = 135
The three reports add up to 205 + 130 + 135 = 470 claimed orders, but the store recorded 300. The channels claim 470 ÷ 300 = 1.57 times the real number, because most customers touched more than one channel. A manager who adds the three dashboards would believe the campaign won 57% more than it did. This is the central problem of cross-channel management, and it is why a shared identity and a single deduplicated count come first.
How does the attribution model change the verdict?
Once orders are counted once, you still have to decide which channel gets credit. Using the same 300 orders and sample spend of $9,000 on paid social, $1,500 on email and $12,000 on search:
| Model | Search | Paid social | Total | |
|---|---|---|---|---|
| First touch | 90 | 75 | 135 | 300 |
| Last touch | 205 | 65 | 30 | 300 |
| Linear (credit split equally across touches) | 142.5 | 80 | 77.5 | 300 |
Credit per path: for linear, a two-touch path gives each channel half an order (Paid social → Search, 50 orders, gives 25 to each) and a three-touch path gives a third (30 orders give 10 each).
Cost per order by model (spend ÷ credited orders):
| Model | Search | Paid social | |
|---|---|---|---|
| First touch | $133.33 | $20.00 | $66.67 |
| Last touch | $58.54 | $23.08 | $300.00 |
| Linear | $84.21 | $18.75 | $116.13 |
Paid social costs $300 per order on last touch and $66.67 on first touch; search flips the other way, $58.54 against $133.33. The same spend looks wasteful or efficient depending on the question. Paid social is mostly an introducer (135 first touches, 30 last), and search a closer (205 last touches, 90 first). Cutting social because last-touch says $300 per order would shrink the supply of people search later converts. No single model is correct; compare several, and ask what would happen to the others if one channel stopped. See attribution for the models themselves and omnichannel analytics for the wider view.
Orders claimed vs real
sample data, one monthHow do you get one set of definitions?
Agree on these in writing before the campaign starts:
| Item | Define it as | Example |
|---|---|---|
| Conversion | One event, with its trigger | purchase with an order ID, counted once per order |
| Channel | A rule on source and medium | Medium email is Email; medium cpc and source meta is Paid social |
| Campaign | A name pattern | yyyy-mm-name, such as 2026-11-launch |
| Window | How far back credit goes | 30 days |
| Currency and time zone | One of each | Report in USD, store time zone |
Tag every link with UTM parameters from a naming sheet, in lowercase, with the same spelling every time: utm_source=newsletter&utm_medium=email&utm_campaign=2026-11-launch. A typo creates a new "channel"; Email and email can show as two. See UTM parameters for the fields and cross-channel marketing for strategy.
| Item | Define it as | Example |
|---|---|---|
| Conversion | One event with its trigger | purchase with an order ID, once per order |
| Channel | A rule on source and medium | Medium email is Email |
| Campaign | A name pattern | yyyy-mm-name, e.g. 2026-11-launch |
| Window | How far back credit goes | 30 days |
| Currency and time zone | One of each | USD, store time zone |
Tag every link from a naming sheet, in lowercase, with the same spelling each time.
How do you get one identity across channels?
Identity is the hardest agreement, and no tool solves all of it. Three layers, from strongest to weakest:
- A login ID. When a person logs in on any device, you can join their activity under one ID. Only logged-in behaviour is covered.
- A hashed email you control. An email click that lands with an identifier lets you tie the email recipient to a site visit.
- Device or browser ID. Works within one browser; a phone visit and a laptop visit are two people.
Expect gaps. Anonymous visitors, people who switch devices and people who never log in will appear as separate visitors, which pushes your multi-touch counts toward single-touch. State the share of conversions you can link to a known person, and treat it as a known limit instead of hiding it.
What does a shared rhythm look like?
A campaign calendar every channel owner can see, with one owner per channel and one owner for the whole campaign:
| When | Who | What |
|---|---|---|
| Two weeks before | Campaign owner | Goal, audience, offer, definitions, UTM sheet |
| One week before | Channel owners | Creative and send times, checked against each other for clashes |
| Launch day | Campaign owner | One dashboard, deduplicated orders, channel breakdown |
| Weekly during | All | 20-minute review: orders, cost per order by two models, changes to make |
| After | Campaign owner | Written result against the goal, what to change next time |
The point of the calendar is to avoid two channels sending the same offer to the same person in the same hour, which is a cost no channel report shows.
Why bother? What does the evidence on multi-channel customers say?
A Harvard Business Review analysis of just over 46,000 customers of one large U.S. retailer over 14 months found that 73% used multiple channels during their shopping journey, against 7% online-only and 20% store-only. After controlling for shopping experience, the multi-channel customers spent 4% more per occasion in store and 10% more online, and made 23% more repeat trips within six months. The authors caution that this is correlation: those customers may simply have been more engaged to begin with. The takeaway for campaign management is the first number: most shoppers use more than one channel, so a measurement that sees one channel at a time misses most journeys.
What is a practical sequence for a cross-channel campaign?
- Write the goal as one number and a date (for example, 300 orders in a month).
- Fix the definitions: conversion event, channel rules, window, campaign name.
- Tag all links from the naming sheet and test them.
- Check that the conversion event fires once per order, with the order ID.
- Set one view that deduplicates orders and shows credit under at least two models.
- Review weekly and change one thing at a time.
- After the campaign, write down the result and one change.
Which mistakes undermine cross-channel campaigns?
- Adding up each channel's own report. The example shows 470 claimed against 300 real.
- Using a single attribution model. The cost per order of paid social ranges from $66.67 to $300.00.
- Inconsistent UTM tags. One typo splits a channel in two.
- No owner for the whole campaign. Each channel optimises itself.
- Ignoring clashes. The same offer from three channels in one hour is a cost.
- Hiding the identity gap. State how many conversions you can link.
How to measure a cross-channel campaign in TapCub
TapCub measures the campaign after the click; it does not send the messages, buy the ads or bid on them. Using the example:
- Tag and read sources. Web analytics › Sources shows visitors by channel, source and UTM; channel rules can be configured, so
emailandcpcfall into the channels you defined. - Define the goal once. In Web analytics › Goals, set the purchase event as the goal; the same goal is shared with All-platform analytics › Business › Goals.
- Compare models side by side. In All-platform analytics › Behavior › Behavior analysis, choose first, last, linear, position and time-decay models at the same time, one column each, with touchpoint set to the channel or UTM campaign; a channel that mostly assists becomes visible. TapCub's attribution uses sessions before the conversion, with a default 30-day lookback that includes the converting session; it is not an install-matching service.
- Import the spend. In All-platform analytics › Business › Channel ROI, import cost by day, channel, source or campaign; the page gives cost per click (spend ÷ sessions), cost per acquisition (spend ÷ purchases in orders) and return on ad spend.
- Tie people together. Call
tapcub.loginafter login so activity from several devices joins under one person in All-platform analytics › Users › People; anonymous visitors have no profile. - Mark launches. Add date annotations under Configuration › Annotations. Bots are counted separately, so crawlers do not enter your campaign denominators.
For the optimisation step that follows, see campaign optimization.
FAQ
What is cross-channel campaign management?
Planning and running one campaign across several channels, with shared audience, message, timing and measurement, so a person who meets the offer in an email and an ad sees one campaign and you can count the result without double-counting.
How do you manage a campaign across multiple channels?
Agree on one identity, one set of definitions (conversion, channel, campaign, window) and one rhythm (owners, calendar, weekly review). In the sample, three channel reports claimed 470 orders against 300 real ones because customers touched several channels.
How do you track cross-channel campaigns?
Tag every link with consistent UTM parameters, fire one conversion event per order, deduplicate orders in one place and compare several attribution models. Add spend by channel to see cost per order under each model.
What is the difference between multichannel and cross-channel?
Multichannel runs separate campaigns on several channels; cross-channel connects them with shared audience, timing and measurement. Omnichannel goes further, aiming for a seamless customer experience across every touchpoint.
Which attribution model should I use for a cross-channel campaign?
Use several and compare. In the sample, paid social cost $66.67 per order on first touch and $300.00 on last touch; a channel that introduces customers looks weak on last touch and strong on first touch.
Sources
- Sopadjieva, E., Dholakia, U. & Benjamin, B. A Study of 46,000 Shoppers Shows That Omnichannel Retailing Works. Harvard Business Review, January 2017 — 73% multi-channel, 7% online-only, 20% store-only; 4% and 10% higher spend; 23% more repeat trips; correlation caveat. Read 2026-11-19.
- Google. Collect campaign data with custom URLs — the standard campaign fields source, medium and campaign. Read 2026-11-19.
Was this article helpful?
We use your answers to fix and expand this page.
Couldn’t send. Please try again in a minute.
Thanks for the feedback. We’ll use it to improve this page.You’ve already sent feedback on this page. Thanks.

Product Adoption Consultant
Explores customer onboarding, live conversations, and self-service, turning common usage questions into practical guidance and improvements.