Try it on your own data
Every report in this article is in the free plan. One snippet for web and apps, up to 10 sites.
Start freeCampaign optimization is the ongoing loop of measuring a live campaign, finding the weakest part, and changing one thing at a time to lower your cost per result. Most wasted budget does not come from bad ideas; it comes from reacting to three days of data, changing several things at once, or trusting a single attribution view. This guide covers the metric and decision window to start with, a fixed diagnosis order, UTM and attribution checks, and a worked budget-shift example.
What you will learn
- Pick one primary metric (e.g. CPA) and wait a full decision window — conversion lag plus learning time plus enough conversions — before calling a change a win
- Diagnose in a fixed order — audience, creative, landing page, budget — and change one variable at a time
- Recheck the same conversions under a second attribution model before moving budget; channel rankings can flip
What is campaign optimization?
Campaign optimization is the repeated loop of measuring a live campaign, finding the weakest part, changing one thing, and measuring again — while the campaign is still running. It is not a one-time setup task and not a post-mortem: the point is to redirect spend and effort before the budget is gone.
The boundary matters. This guide covers in-flight decisions only: what to watch, how long to wait, what to change first. Reviewing a finished campaign — what worked, what to repeat next time — is a different job, covered in marketing campaign analysis.
Most campaign optimization strategies fall into two families: changing the campaign itself (audience, creative, landing page, budget) and changing how you measure it. This guide stays on the measurement side of the first family — which numbers to trust, when to trust them, and in what order to act. It does not cover ad-platform bidding consoles; everything below works without touching a bid setting.
Pick one primary metric and a decision window
Pick one number that matches the campaign's goal and judge every change against it. For a campaign buying leads or purchases, that is usually cost per acquisition (CPA): spend ÷ conversions. Click-through rate, impressions and engagement are diagnostic metrics — they help you find the problem, but they are not the verdict. Watching five metrics at once is how teams talk themselves into whichever story looks good today.
Then decide how long you will wait before judging a change. A decision window has three parts:
- Conversion lag. Conversions arrive days after the click. Google Ads counts conversions within a conversion window that defaults to 30 days, so today's spend is not today's full result (About conversion windows).
- Learning time. After a structural change, automated bidding needs to re-stabilize: Google's documentation describes a Learning status that lasts up to 7 days after such changes (About Smart Bidding learning). Judging a change mid-learning reads noise as signal.
- Enough conversions. A handful of conversions is not a verdict. In the example below, Channel A's first three days show a $90 CPA — scary, and meaningless at three conversions.
Write the window down before you launch — 14 days in the worked example below — and only compare at the end of it. If one more conversion would flip your ranking, you do not have enough data yet.
Diagnose in order: audience → creative → landing page → budget
When CPA drifts up, resist the urge to change everything. Work through four layers in a fixed order, because an upstream problem disguises itself as a downstream one:
- Audience. Are the right people seeing the ads? Cheap clicks from the wrong segment look like a creative problem but are a targeting problem.
- Creative. Do the right people click? If reach holds but click-through falls, the message or the asset is tired — not the audience.
- Landing page. Do clicks turn into goals? Traffic that arrives and bounces is a page problem; see landing page conversion rate for how to read it.
- Budget. Only after the first three layers check out, move money between channels. Shifting budget into a broken landing page just buys more bounces.
The table after this section pairs each layer with its symptom, the first thing to check, and the single change to test. Budget sits last on purpose: it amplifies whatever the layers above are doing, good or bad. This order is the whole of ad campaign optimization on the measurement side — no console gymnastics required.
| Layer (in order) | Symptom | Check first | One change to test |
|---|---|---|---|
| Audience | Spend is high; clicks are cheap but never convert | Who actually sees the ads: source / UTM mix, device, geography | Narrow or swap one audience segment |
| Creative | Reach holds but click-through rate falls | Which asset gets the clicks; compare strongest vs weakest | Replace one headline or visual, keep the rest |
| Landing page | Clicks arrive; goal completion is low, bounce is high | Page-level conversion and behavior for that campaign's page | Change one element: headline, form length or CTA |
| Budget | One channel's CPA climbs while another holds | CPA by channel under one model, over a full window | Move a fixed slice from the worse channel to the better one |
Work top to bottom: fix the first layer that shows a symptom before moving to the next.
Change one variable at a time
If you swap the audience, rewrite the headline and redesign the page in the same week, CPA may improve — and you will not know which change did it. Worse, two changes can cancel each other out and hide a win.
Run one change per decision window:
- Log it. Date, what changed, why, what you expect, and when the window ends. A shared sheet is enough.
- Wait the full window. Conversion lag and learning time do not shrink because you are impatient.
- Judge against the primary metric only. If CPA improved and this was the only change, you have a candidate to keep. If not, roll it back and move to the next layer.
When several layers look broken, fix them in diagnosis order — one at a time. It feels slower; it is the only way to end up knowing what works. Teams that change five things a week end up with a campaign nobody can explain.
Keep UTM naming consistent
If your analytics reports and your ad platform disagree about which channel drove what, check the tags before you blame the tracking. UTM parameters are the labels you append to campaign URLs, and analytics tools group traffic by their exact values. One channel typed three ways becomes three channels in your reports — and your CPA-by-channel math quietly breaks.
Agree on a convention and enforce it:
| Parameter | Consistent | Splits your reports |
|---|---|---|
| utm_source | newsletter | Newsletter, email, NL |
| utm_medium | Email, e-mail, mail | |
| utm_campaign | 2026-11-black-friday | BF2026, black_friday, BlackFriday |
Lowercase, one separator, a fixed date format, and a shared list of allowed values. Google's URL builder documentation recommends consistent naming for exactly this reason. For the parameters themselves see UTM, and for a naming walkthrough see name UTM parameters. Fix naming before you diagnose anything else — every section below reads cleaner data.
View the same conversions under different attribution models
Before you move budget, ask which channel gets credit for a conversion. A touchpoint is any session that touched the journey before the goal; attribution models decide how credit is split among them. Last touch gives everything to the final session — which systematically over-credits the channels that close and under-credits the ones that introduce. Google's attribution models documentation explains the common models: first touch, last touch, linear, position-based and time decay.
The practical move is to look at the same conversions under at least two models before a big reallocation. Google Analytics' model comparison report lines up the same key events under different models side by side; the principle is what matters — rankings can flip without a single new conversion. The worked example below shows exactly that: the cheaper channel under last touch becomes the more expensive one under first touch. For a side-by-side walkthrough, see compare attribution models.
Worked example: two-channel CPA and a budget shift
Sample data, 14-day decision window, two channels, one goal. All figures below are sample arithmetic, not promises about your campaigns.
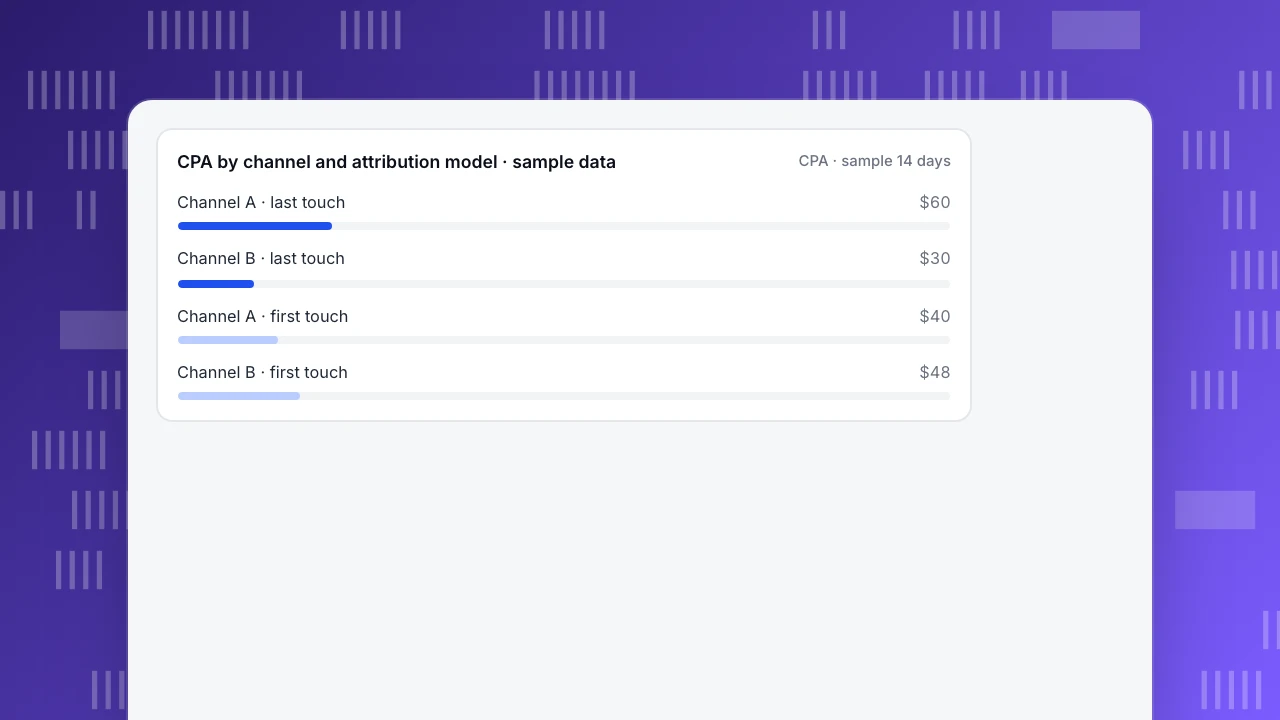
Baseline (last touch). Channel A: $1,800 spend, 30 conversions → CPA $1,800 ÷ 30 = $60. Channel B: $1,200, 40 conversions → CPA $1,200 ÷ 40 = $30. Blended: $3,000 ÷ 70 = $42.86. B looks twice as efficient.
Same conversions, first touch. The 70 conversions split A 45 / B 25 (45 + 25 = 70). CPA A = $1,800 ÷ 45 = $40; CPA B = $1,200 ÷ 25 = $48. The ranking flips: A opens most journeys, B closes them. Suppose the team's agreed credit rule is last touch — then the first-touch view is a reason to shift a slice rather than shut A off, because A opens 45 of the 70 journeys.
Shift $600 from A to B, assuming CPA holds. A: $1,200 ÷ $60 = 20 conversions. B: $1,800 ÷ $30 = 60. Total 80; blended CPA $3,000 ÷ 80 = $37.50, down 12.5% from $42.86 ((42.86 − 37.50) ÷ 42.86 ≈ 12.5%).
Break-even. The shift only wins while B's CPA stays at or under $36: A's 20 + $1,800 ÷ $36 = 20 + 50 = 70 conversions, the original total. Above $36, the same money buys fewer conversions than before.
Tiny-sample guard. On days 1–3, A spent $270 for 3 conversions — a $90 CPA. Cutting A then would have been a verdict on three conversions. The full window shows $60.
Projections assume CPA holds as spend scales; it rarely does exactly. Re-measure after the next full window.
CPA by channel and attribution model · sample data
CPA · sample 14 daysHow to do this in TapCub
TapCub does not run campaigns or touch bids and budgets. What it does is put the numbers from the worked example, spend, conversions and two attribution views, on one screen so the decision is yours to make with full information.
- Define the conversion once. In Web analytics › Goals, one event or page counts as one conversion; it is the same data as All-platform analytics › Business › Goals. Every CPA in this guide divides by this number.
- Clean the traffic before judging it. Web analytics › Sources groups visits by channel using UTM parameters, the referring host and click IDs (a
gclidormsclkidvisit is paid search by default). Inconsistent UTM names show up here as duplicate rows; fix them before the decision window starts. Bot traffic is counted separately from people, so a crawler spike does not inflate sessions and deflate your conversion rate. - Put spend next to results. In All-platform analytics › Business › Channel ROI, import spend by day, channel, source and campaign (CSV, or one row at a time). The page then shows cost per click (spend ÷ sessions), cost per acquisition (spend ÷ purchases on the order ledger) and return on ad spend, grouped by channel, source or campaign. If your conversion is a lead rather than a purchase, divide the same spend by the goal count from step 1 to get the example's CPA.
- Run the flip test. In All-platform analytics › Behavior › Behavior analysis, the attribution model credits sessions before the conversion. Select last touch and first touch together and you get the two columns the example compares; position and time decay are there too. The lookback window defaults to 30 days and goes from 1 to 90; match it to your decision window.
- Re-measure after the window. Save the view and rerun it when the next full window closes, rather than checking daily. The tiny-sample guard above applies to every report.
FAQ
How long should you wait before optimizing a campaign?
Wait one full decision window: enough time for conversions to arrive (Google Ads' conversion window defaults to 30 days), for automated bidding to finish learning after structural changes (up to 7 days in Google's documentation), and for enough conversions to accumulate that one more would not flip your ranking. Judging earlier reads lag and noise as results.
How often should you optimize a campaign?
Check for anomalies daily — broken tracking, a landing page error, spend spikes — but make deliberate changes on a fixed cadence tied to your decision window, for example weekly for high-volume campaigns and longer for low-volume ones. Every change restarts the clock: conversion lag and learning time apply again, so daily tinkering guarantees you never see a clean result.
Should you pause a campaign or optimize it?
Pause for clear failures: broken tracking, a dead landing page, spend running away with zero conversions. Otherwise optimize: pausing stops the data you need, and the problem usually survives the pause. If CPA is merely high, work through audience, creative and landing page in order — pausing fixes none of them, and you still have to wait a full window after restarting.
Do you need multi-touch attribution to reallocate budget?
Not to start — last touch is a workable default, but it over-credits closing channels. Before a large shift, view the same conversions under at least one more model; if the channel ranking flips, resolve which model fits your goal before moving money. A small shift with a break-even check is safer than a large shift justified by one model.
What are common campaign optimization mistakes?
Judging changes before the decision window ends; changing several variables at once and crediting the wrong one; inconsistent UTM naming that splits one channel into many; reallocating budget on a single attribution model; and chasing clicks or impressions instead of the one primary metric tied to the campaign's goal. Each is avoidable with a written window and a change log.
Sources
- Google Ads Help. About Smart Bidding learning — Learning status after structural changes. Verified 2026-11-14.
- Google Ads Help. About conversion windows — conversion window definition and default. Verified 2026-11-14.
- Google Ads Help. About attribution models — credit assignment and model differences. Verified 2026-11-14.
- Google Analytics Help. URL builders: Collect campaign data with custom URLs — UTM parameters and naming. Verified 2026-11-14.
- Google Analytics Help. Key event attribution models report — comparing models on the same conversions. Verified 2026-11-14.
Was this article helpful?
We use your answers to fix and expand this page.
Couldn’t send. Please try again in a minute.
Thanks for the feedback. We’ll use it to improve this page.You’ve already sent feedback on this page. Thanks.

Product Analyst
Focuses on event analysis, conversion funnels, and retention, using clear metric definitions and structured analysis to explain product performance.