Try it on your own data
Every report in this article is in the free plan. One snippet for web and apps, up to 10 sites.
Start freeCustomer analysis is using what customers do and buy to make a business decision. It starts from one of four questions: who comes, who stays, who spends and who leaves. Each needs different data and a different method, so the first step is choosing the question and the decision behind it, not opening a report.
What you will learn
- Pick one question that ends in a decision: where to spend, who to keep, who to watch, who to win back
- In the sample, the top 10% of customers produce 40% of revenue at $400 each; 36 of them have gone quiet, worth up to $14,400 (6.0%)
- Count identified people with one row each; anonymous visitors cannot be in retention or spend analysis
What customer analysis is, and the four questions it answers
Customer analysis is the practice of using what customers do and buy to decide something about the business. The decision is the point. Without one, you end up with a dashboard of customer counts that nobody acts on.
Most customer analysis questions fall into one of four groups, and each group needs different data and a different method. If you start by opening a report, you will answer whichever question the report happens to answer. If you start by choosing the question, the report follows.
The table below sets the four questions side by side with the data, method and TapCub report for each. The rest of this page is the five steps to follow, a worked example with numbers you can recompute, and the mistakes that waste the most time.
| Question | Data you need | Method | Where in TapCub |
|---|---|---|---|
| Who comes? | First source, first order, country, device | Compare customers by first source | Web analytics › Sources; All-platform analytics › Users › People |
| Who stays? | Order or activity dates per person | Cohort retention | All-platform analytics › Behavior › Behavior analysis (retention) |
| Who spends? | Order value per customer | Spend concentration, RFM | All-platform analytics › Users › Segments & tags |
| Who leaves? | Last order, usual gap between orders | Current gap against the customer's own pattern | All-platform analytics › Behavior › Behavior analysis (lifecycle) |
Choose by the decision you need to make; answer the others later.
Step 1: Pick one question and the decision behind it
Write the question as a sentence that ends in a decision: "Which customers should we contact before the end of the quarter?" is a customer analysis question. "What do our customers look like?" is not, because no answer to it changes anything.
Use these rules to choose:
- If the decision is about where to spend acquisition money, the question is who comes.
- If the decision is about onboarding, product changes or follow-up emails, the question is who stays.
- If the decision is about which customers deserve attention, the question is who spends.
- If the decision is about win-back or support, the question is who leaves.
Pick one. A second question can follow once you have an answer. Teams that try to answer all four in one pass end up with four half-finished charts.
The reason to start with retention and spend, when you have no better guide, is that they decide how much a customer is worth. A widely quoted claim, credited to Frederick Reichheld of Bain & Company in a Harvard Business Review article, says that raising retention by 5% can raise profits by 25% to 95%. How much it changes depends on the business, so treat it as a reason to measure, not as a forecast.
Step 2: Decide who counts as a customer
Before counting, write down who is in the group. Most customer analysis errors start here.
- Anonymous visitors are not customers. A visitor who has not logged in or ordered has no history you can follow across devices, so they cannot be in a customer segment. Count identified people or people with orders, and say so.
- One person, one ID. If the same buyer logs in on a phone and a laptop, that is one customer. If your data has two IDs for them, you will overstate customers and understate repeat rate.
- Remove test accounts and bots. Staff test orders and crawler traffic make small groups look bigger and can distort rates by several points.
- Fix the clock. Decide the period (for example, the last 12 months) and the date a customer enters the group (first order, first login). Keep both fixed for the whole analysis.
If you cannot identify people at all, you can still do the who comes question using visitors and sources. The other three need a person.
Step 3: Get one row per customer
Most methods work on a table with one row per customer. A minimum version has five columns: customer ID, first order date, last order date, number of orders and total spend. Add first source, country or plan if you want to compare groups.
Two checks catch most data problems:
- Totals reconcile. Sum total spend across rows and compare it with revenue in your store or billing system for the same period. A gap above a few percent means refunds, currencies or duplicate rows are mixed in.
- No impossible rows. A last order date earlier than the first order date, or a customer with orders but no spend, points to a join problem.
Do this once, then reuse the table. Rebuilding it for every question is the slowest part of customer analysis.
Step 4: Run the one method that fits the question
Each question has a plain method. You do not need a model to start.
Who comes: compare groups by first source. Count customers and revenue by the source of their first visit or first order. The point is to compare spend per customer, not just customer counts: a source that brings many customers who spend little can be worse than one that brings fewer who spend more.
Who stays: cohort retention. Take everyone whose first order was in one period, and count how many ordered again in the next periods. Compare cohorts of the same age; a three-month-old cohort cannot be compared with a twelve-month-old one. The fuller treatment is in customer churn analysis.
Who spends: concentration. Rank customers by spend and split into bands. If a small band produces a large share of revenue, those customers get their own attention. Recency, frequency and spend together are RFM; see RFM.
Who leaves: gap against the customer's own pattern. A customer who normally orders every 30 days and has not ordered for 75 is quiet. One who normally orders every 120 days is not. Compare each person's current gap with their usual gap, instead of applying one cut-off to everyone.
For more depth on each method, the related pages are customer data analytics, customer segmentation analysis and customer needs analysis. This page stays at the level of choosing the question and running a first pass.
A worked example: one store, four questions
Sample data: an online store had 2,400 customers who ordered in the last 12 months, producing $240,000 in revenue. That is an average of $100 per customer.
Who comes. By first source:
| First source | Customers | Revenue | Revenue per customer | Share of customers | Share of revenue |
|---|---|---|---|---|---|
| Organic search | 960 | $91,200 | $95 | 40% | 38% |
| Paid ads | 720 | $64,800 | $90 | 30% | 27% |
| Email and direct | 480 | $67,200 | $140 | 20% | 28% |
| Referral | 240 | $16,800 | $70 | 10% | 7% |
| Total | 2,400 | $240,000 | $100 | 100% | 100% |
Email and direct bring one customer in five and 28% of revenue. Referral customers spend half as much as email and direct customers. This does not prove which source is better, because it says nothing about what each source cost, but it tells you where to look next.
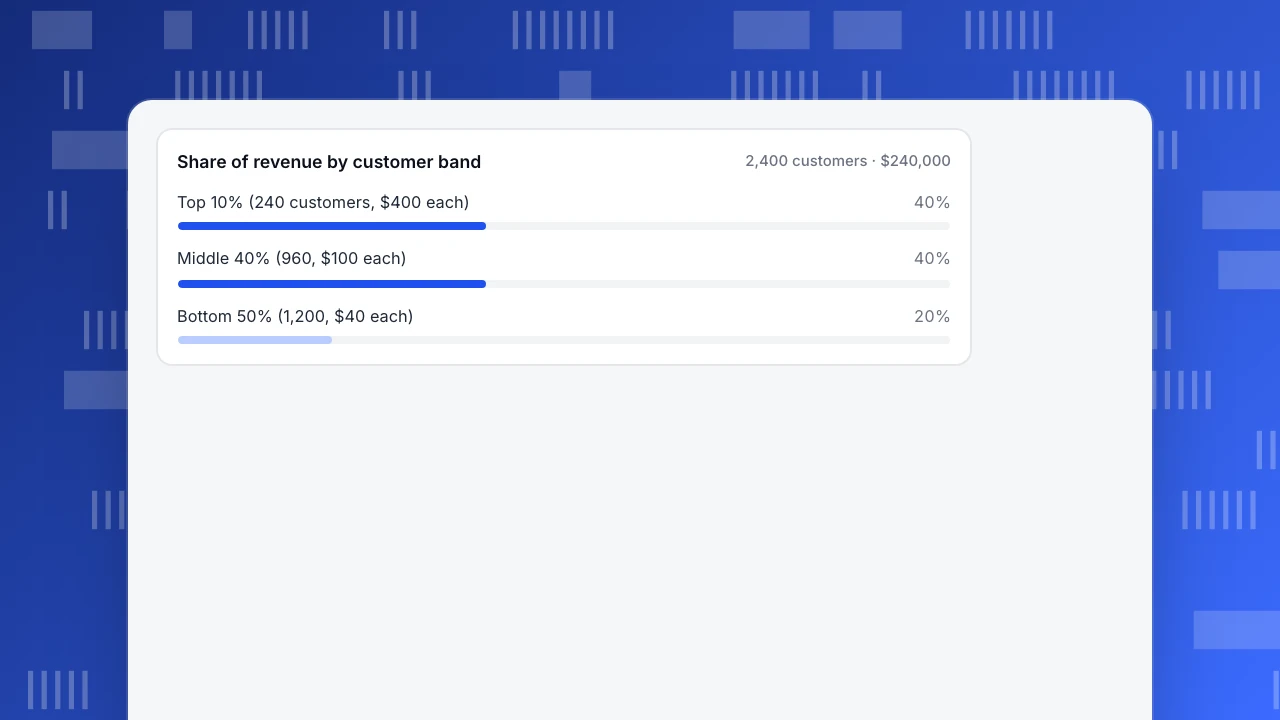
Who spends. Ranked by spend: the top 10% of customers (240) produced $96,000, which is 40% of revenue and $400 each. The middle 40% (960) produced $96,000 ($100 each). The bottom 50% (1,200) produced $48,000 (20%), or $40 each.
Who stays. 600 customers placed their first order in the first quarter. 168 of them ordered again within the next 90 days: 168 ÷ 600 = 28%.
Who leaves. Among 1,100 customers with two or more orders, 310 have not ordered for 180 days: 310 ÷ 1,100 = 28.2%. Customers who have never reordered are a different group and are left out here.
Put side by side, the four numbers say that revenue is concentrated, about 28% of first-quarter customers come back, and about 28% of repeat customers have gone quiet. None of them says what to do. Step 5 does that.
Share of revenue by customer band
2,400 customers · $240,000Step 5: Turn the finding into one decision
Take the question you picked in step 1 and write the finding, the decision and the number that will show whether it worked.
Using the store above, with who spends as the question:
- Finding. The top 10% of customers produce 40% of revenue, $400 each.
- Check. Of those 240 customers, 36 have not ordered in the last 90 days.
- Size. 36 × $400 = $14,400, which is 6.0% of annual revenue ($14,400 ÷ $240,000).
- Decision. Contact those 36 personally this month.
- Measure. In 60 days, how many of the 36 have ordered again?
The 6.0% figure assumes these customers keep spending at their past rate, so it is an upper bound on what is at stake, not a forecast. The value of the exercise is that the number is small enough to act on this month.
If you picked who leaves instead, the same method applies: find the group, size it with their past spend, choose one action and set a number to check in two months.
Common mistakes in customer analysis
- Starting with the tool, not the question. A report answers its own question, not yours. Pick the question first.
- Using averages for skewed data. In the example, the average customer spends $100, but half the customers spend $40. When a few customers dominate, show the bands.
- Mixing cohorts of different age. A cohort that is 3 months old has had less time to reorder than one that is 12 months old.
- Calling anonymous visitors "customers". Segments and retention need an identity. Say which group you counted.
- Reading a source split as proof of cause. Customers from one source may spend more because they were already a better fit.
- Stopping at the finding. A chart with no decision attached gets looked at once and forgotten.
Run this analysis in TapCub
Take the store above and follow the same four questions.
- Who comes. Web analytics › Sources shows channels, referrers and UTM with visitors, sessions and conversions, plus an AI sources tab for visits from AI products. For customers, open All-platform analytics › Users › People: after
tapcub.logina person has a day-by-day timeline of their activity (identify users). TapCub matches visits to a person only after login; anonymous visitors are not in customer segments. - Who stays. In All-platform analytics › Behavior › Behavior analysis, build a retention report with the first order as the start event and a later order as the return event. Each row is a cohort with its size and a rate per period (build a retention report). Periods that have not ended show empty, not zero.
- Who spends. Create an RFM segment in All-platform analytics › Users › Segments & tags: 10 buckets, recomputed daily, with the movements between them recorded (run RFM analysis). The commerce view in All-platform analytics › Business › Commerce & revenue needs purchases on the order ledger first (track ecommerce purchases).
- Who leaves. The lifecycle view in All-platform analytics › Behavior › Behavior analysis counts new, returning, resurrecting and dormant people by week or month, and the inactivity view counts people quiet for 7, 14, 30, 60 or 90 days.
- Save the list. A segment can be used as a group in a funnel or retention report (create user segments).
TapCub does not store CRM notes, send emails or run surveys. It tells you who the customers are and how they behave; the contact itself happens in your own tools, or in a chat if the customer is on your site.
FAQ
What is customer analysis?
Customer analysis is using data about what customers do and buy to make a business decision, such as where to spend acquisition money, who to contact before they leave, or which customers deserve attention. It covers four questions: who comes, who stays, who spends and who leaves, each with its own data and method.
What are the types of customer analysis?
Common types are behavioral analysis (what people do and buy), demographic analysis (who they are), retention or cohort analysis, value analysis such as lifetime value and RFM, and segmentation. This article groups them by the question each one answers, because the question decides which data and which method you need.
How do you do a customer analysis?
Pick one question tied to a decision. Decide who counts as a customer, build one row per customer with first order, last order, order count and spend, run the method that fits the question, then write down one decision and the number that will show whether it worked. A first pass can take an afternoon.
What data do you need for customer analysis?
At minimum: a customer ID, the first and last order dates, the number of orders and total spend. Add first source, country or plan to compare groups. Without an ID that follows a person across visits, you can still analyze visitors and sources, but not retention or spend by customer.
How is customer analysis different from customer segmentation?
Segmentation is one method inside customer analysis: it splits customers into groups. Customer analysis is wider, because it starts from a business question and may use segmentation, retention, spend concentration or churn gaps to answer it. For the segmentation method itself, see customer segmentation analysis.
See also: Customer Analytics Software: What to Check Before You Choose.
Sources
- Harvard Business Review, The Value of Keeping the Right Customers (credits Frederick Reichheld of Bain & Company with the 5% retention and 25% to 95% profit finding). Checked 2026-11-18.
- Wikipedia, RFM (market research) (recency, frequency and monetary value as dimensions for valuing and segmenting customers). Checked 2026-11-18.
Was this article helpful?
We use your answers to fix and expand this page.
Couldn’t send. Please try again in a minute.
Thanks for the feedback. We’ll use it to improve this page.You’ve already sent feedback on this page. Thanks.

Product Experience Specialist
Writes about product experience, practical workflows, and growth, turning complex processes into clear steps for everyday decisions.