Try it on your own data
Every report in this article is in the free plan. One snippet for web and apps, up to 10 sites.
Start freeAI onboarding means using AI at the specific steps where new users stall: answering setup questions, tailoring a checklist, helping with imports. Judge it by activation rate and step conversion, not by how clever the AI is. In the sample below, activation rose from 32.0% to 36.2% (95% interval +1.26 to +7.14 points), but a before-and-after number can mislead, so the caveats and a holdout design matter as much as the lift.
What you will learn
- Put AI only where users stall and ask for help, then judge it by activation rate and the step it was meant to move
- Activation rose from 32.0% to 36.2% (p = 0.0051, interval +1.26 to +7.14 points) but two different cohorts are not an experiment
- A random 10% holdout removes traffic mix, seasonality and definition drift in one go; 2,000 sign-ups per period detects 4.2 points but not 3
What is AI onboarding, and where can AI help a new user?
AI onboarding means using AI at specific steps of the path from sign-up to a user's first real result: answering setup questions, tailoring a checklist, helping with data import. It is useful at the steps where new users stall and ask for help. It adds nothing at steps where they do not stall.
That restraint matters, because onboarding itself is a cost to the user. Nielsen Norman Group's research on app onboarding says it adds interaction cost and memory strain, advises avoiding it where possible, and recommends testing first: check whether users struggle without it, improve the design if they do, and keep an onboarding flow only if it measurably helps (NN/g). It also favours tips shown in context over a front-loaded tutorial. AI fits that preference when it answers the question a user has at the moment they have it.
| AI step | What it does | Where it helps | Where it is wasted |
|---|---|---|---|
| Setup assistant | Answers "how do I connect X?" from your help material | Steps with a high question rate | Steps nobody asks about |
| Role-based checklist | Picks the next 3 tasks from the user's stated role | Products with several distinct use cases | Products with one obvious first action |
| Data import helper | Suggests how to map columns or fix errors | Steps with an upload or connection | Anywhere without messy input |
| Timed nudges | Suggests the next step when a user goes idle | Long setups with a clear next action | Short setups; users who are simply thinking |
A step that a user can already complete without help gains nothing from an AI layer. Find the stalls first, and only then decide where to put AI.
What should you measure to judge an onboarding flow?
Pick one outcome metric and a few diagnostic ones, and fix the definitions before you change anything.
| Metric | Definition | Why it matters |
|---|---|---|
| Activation rate | Users who reach the activation event within 7 days ÷ users who signed up | The outcome the flow exists to move |
| Step conversion | Users who complete step N ÷ users who completed step N−1 | Shows where people stall |
| Time to activate | Median days from sign-up to the activation event | Speed to value |
| Setup questions per sign-up | Chats and tickets about setup ÷ sign-ups | Shows whether help is needed |
| Assisted share | Setup questions answered without a person ÷ setup questions | Shows whether the AI step is doing work |
Choose an activation event that reflects value, not effort. In the example below it is "viewed the first report with real data", not "created an account". For definitions of the other standard onboarding measures, see onboarding metrics, and for the surrounding process, customer onboarding system.
| Metric | Definition | Why it matters |
|---|---|---|
| Activation rate | Reached the activation event within 7 days ÷ sign-ups | The outcome the flow should move |
| Step conversion | Completed step N ÷ completed step N−1 | Shows where people stall |
| Time to activate | Median days from sign-up to activation | Speed to value |
| Setup questions per sign-up | Setup chats and tickets ÷ sign-ups | Shows whether help is needed |
| Assisted share | Setup questions answered without a person ÷ setup questions | Shows whether the AI step does work |
Fix the definitions before you change anything; pick an activation event that reflects value, not effort.
What does an onboarding flow with AI steps look like?
Take a sample analytics product with a 5-step path. All numbers are sample data, recomputed in Python. Two cohorts of 2,000 sign-ups each: four weeks before the AI setup assistant launched, and four weeks after.
| Step | Before: users | Before: step rate | After: users | After: step rate |
|---|---|---|---|---|
| 1. Signed up | 2,000 | 2,000 | ||
| 2. Verified email | 1,700 | 85.0% | 1,712 | 85.6% |
| 3. Created a project | 1,030 | 60.6% | 1,180 | 68.9% |
| 4. Connected a data source | 740 | 71.8% | 880 | 74.6% |
| 5. Viewed the first report (activated) | 640 | 86.5% | 724 | 82.3% |
Two AI steps were added: a setup assistant in the chat window that answers "how do I install this?" and "why is no data arriving?" from the help material, and a role-based checklist shown after email verification.
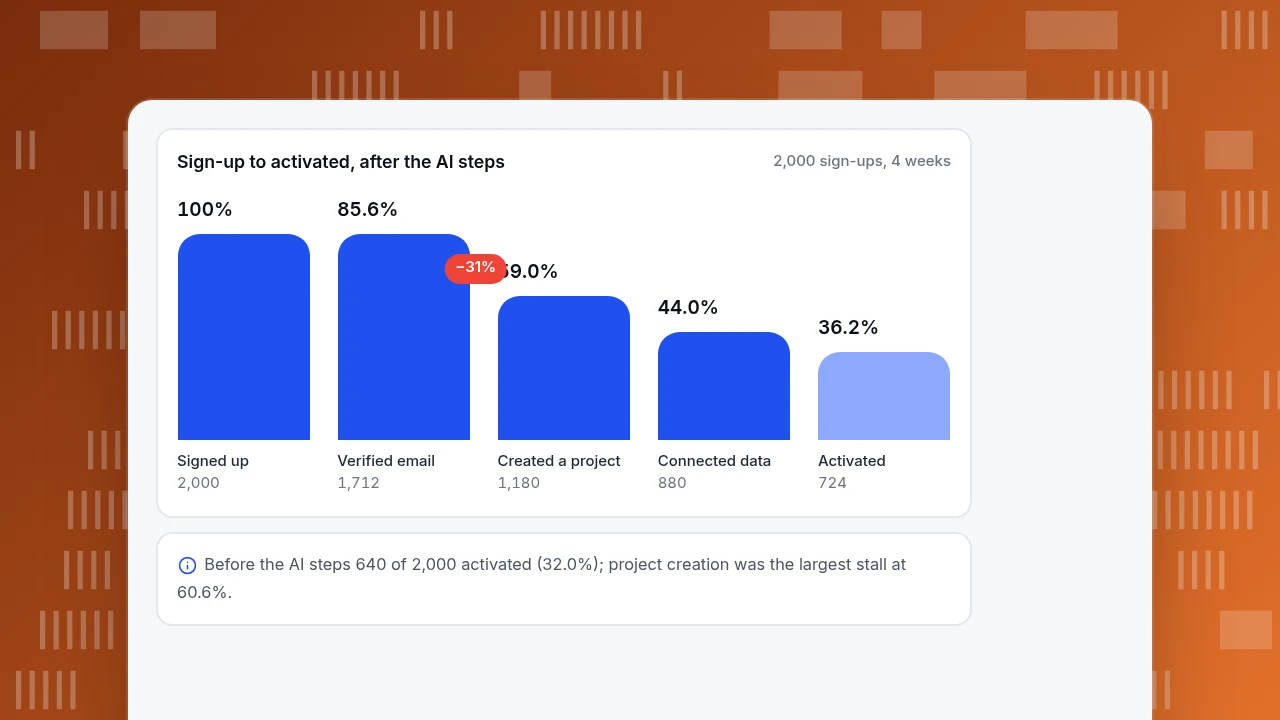
Read the table from the biggest stall. Before the change, only 60.6% of verified users created a project: that is where 670 people disappeared. After the change the step rate was 68.9%, +8.3 points, the largest improvement in the funnel. Step 4, connecting data, moved from 71.8% to 74.6%. That matches where the assistant answers questions, which is evidence that it did something.
The last step went the other way: 86.5% down to 82.3%. That is not a failure. More people now reach step 5, and the extra ones are marginal users who were less likely to finish, so the average step rate falls even though more people finish (724 against 640). Always read step rates together with counts.
Other sample measures over the same two periods: setup questions per sign-up fell from 540 ÷ 2,000 = 0.27 to 410 ÷ 2,000 = 0.205, 290 of the 410 (70.7%) were answered without a person, and the median time to activate fell from 3.1 to 2.4 days.
Sign-up to activated, after the AI steps
2,000 sign-ups, 4 weeksSigned up
2,000
Verified email
1,712
Created a project
1,180
Connected data
880
Activated
724
How do you calculate the before-and-after effect?
The activation rate is activated ÷ sign-ups:
- Before: 640 ÷ 2,000 = 32.0%
- After: 724 ÷ 2,000 = 36.2%
- Difference: 4.2 percentage points, a relative lift of 13.1%.
To see whether the difference is larger than chance, use a two-proportion test:
- Pooled rate = (640 + 724) ÷ 4,000 = 34.1%.
- Standard error under "no difference" = √(0.341 × 0.659 × (1/2,000 + 1/2,000)) = 0.01499.
- z = 0.042 ÷ 0.01499 = 2.80, giving a two-sided p-value of 0.0051.
- 95% interval for the difference, with unpooled standard error 0.01498: 0.042 ± 1.96 × 0.01498 = +1.26 to +7.14 points, or +4.0% to +22.3% relative.
So the lift is statistically significant, and the plausible range runs from small to large. The size of the cohorts is also worth noticing: 2,000 sign-ups per period is just enough to detect a 4.2-point change at 80% power (the formula needs 1,999 per group). A 3-point change, from 32% to 35%, would need 3,884 per group, so this design could not have reliably detected a smaller improvement. For the formula, see A and B testing.
Why can a before-and-after number mislead?
Two different groups of people, in two different periods, with a change in between: that is not an experiment. Anything else that moved can produce the same difference. Researchers who run thousands of controlled experiments warn that "any figure that looks interesting or different is usually wrong" and that when a result looks too good, you should look for the bug before celebrating (Kohavi et al., 2014).
Check each of these before crediting the AI steps:
| Check | What to compare | If it differs |
|---|---|---|
| Traffic source mix | Share of sign-ups from each channel in the two periods | A campaign that brings more motivated users inflates activation |
| Plan or product changes | Release notes for both periods | A simpler sign-up form changes who signs up |
| Calendar | Same weeks of the month; holidays | Seasonal users activate differently |
| Definition drift | The activation event and its tracking | A tracking fix can move the number on its own |
| Sample ratio | Sign-up counts per period against expectation | Missing data on one side |
The stronger design is a holdout: show the AI steps to 90% of new users and withhold them from a random 10%, then compare activation between the two groups at the same time. That removes every item in the table at once. Your own product has to do the random assignment; the measurement afterwards is the same two-proportion test as above.
Which AI steps should you keep, and which should you cut?
Decide per step using the metric that step is meant to move.
| Result | Step rate moves | Questions answered by AI | Decision |
|---|---|---|---|
| Clear gain | Up beyond the interval's lower bound | Many | Keep and extend |
| Gain at the right step, no gain elsewhere | Up only where the AI answers | Many | Keep where it works; remove elsewhere |
| No change | Flat | Few | Cut: NN/g's advice is to keep onboarding only if it measurably helps |
| Higher activation, lower day-7 return | Up, then down | Any | Look at who the extra activations are before keeping it |
In the example, the setup assistant and the checklist were added together, so the table above cannot tell you which one produced the project-creation gain. To separate them, switch one off for a random slice of users, or stage the launch a few weeks apart and compare step rates.
How do you measure AI onboarding in TapCub?
TapCub does not build product tours, in-app checklists or onboarding messages, and it does not run holdouts. Your product shows the steps; TapCub measures what happened. For the example:
- Recognise users. Call
tapcub.login()at sign-in so each user appears in All-platform analytics › Users › People with a day-by-day timeline. Send the key steps as events: email verified, project created, data source connected, first report viewed. - Build the funnel. In All-platform analytics › Behavior › Behavior analysis, add the five steps (up to 20 are allowed) and set the conversion window to 7 days. Each step shows count, rate against step one, rate against the previous step, drop-off and median time; the largest drop is marked.
- Compare the two periods. The funnel has no compare-period option, so run it once for the four weeks before launch and once for the four weeks after, and read the two step tables side by side. Use the breakdown on the first layer (for example by source) to check that the channel mix did not move.
- Check retention for the activated. In the same page, use retention to see whether people who activated in the later period come back in week 2 as often as before.
- Watch the questions. In Live chat › Reports, resolution rate and knowledge base hit rate show how many setup questions the AI answered from your knowledge base. TapCub's AI only drafts replies from that knowledge base; it does not change settings or perform setup for the user. Add the questions that stall people to Live chat › Knowledge base as exact-match Q&A, and pin them so visitors can read the answer without opening a conversation.
FAQ
What is AI onboarding?
Using AI at chosen steps between sign-up and a user's first result: answering setup questions, tailoring a checklist, helping with imports or nudging stalled users. It is justified only where users stall.
How do you measure whether AI onboarding works?
Compare the activation rate (activated within 7 days ÷ sign-ups) before and after, with a confidence interval, and check traffic mix and definitions. A random holdout of new users gives a cleaner answer.
What is a good activation rate?
It depends on your activation event and audience, so there is no reliable universal number. Compare yourself to your own history and watch the step where most users stall. The sample here went from 32.0% to 36.2%.
Does AI onboarding replace a human customer success team?
No. In the sample, 70.7% of setup questions were answered without a person and 29.3% still needed one. AI handles repeated questions; people handle unusual setups and judgement calls.
How many users do you need to test an onboarding change?
For a 32% baseline, about 1,999 per group detects a 4.2-point lift with 80% power, and 3,884 per group detects a 3-point lift. Smaller changes need many more.
Sources
- Nielsen Norman Group. Mobile-App Onboarding: An Analysis of Components and Techniques. Read 2026-11-20.
- Kohavi, R., Deng, A., Longbotham, R., Xu, Y. (2014). Seven Rules of Thumb for Web Site Experimenters. KDD 2014 (DOI 10.1145/2623330.2623341).
Was this article helpful?
We use your answers to fix and expand this page.
Couldn’t send. Please try again in a minute.
Thanks for the feedback. We’ll use it to improve this page.You’ve already sent feedback on this page. Thanks.

Technical Engineer
Focuses on tracking code, SDKs, and API integrations, with practical guidance on implementation checks and troubleshooting.