Try it on your own data
Every report in this article is in the free plan. One snippet for web and apps, up to 10 sites.
Start freeA customer lifecycle marketing strategy gives each stage one goal, one tactic and one metric: acquire, activate, convert, retain, win back and advocate. Pick the stage to fix by reading four counts each period: new, returning, resurrecting and dormant customers. In our sample, retention fell from 65.0% to 60.0% and the replacement ratio to 0.80, so retention came before acquisition.
What you will learn
- Give each stage one goal, one tactic and one metric, and work on one stage at a time
- Read new, returning, resurrecting and dormant counts: retention rate and replacement ratio ((new + resurrecting) ÷ dormant) show which stage is leaking
- Judge tactics against a random holdout and over at least one full reorder cycle
What is customer lifecycle marketing and how is it different from a funnel?
Customer lifecycle marketing is planning your messages, offers and product experience around the stage each customer is in, from first visit to long-term customer or lapsed one, instead of sending everyone the same thing. A funnel stops at the purchase. A lifecycle keeps going: onboarding, repeat purchase, drifting away and winning back.
The practical benefit is that each stage has one goal and one number. You stop asking "is marketing working?" and ask "of the people who bought last month, how many bought again, and what did we do for those who did not?"
A useful measurement frame already exists in Google Analytics: its Life cycle collection of reports groups reporting into Acquisition (how users arrive), Engagement (what they do), Monetization (revenue) and Retention (the Retention overview report). Use those four as your reporting spine, and add stages Google does not name, such as activation and win-back, from your own events. The metrics are detailed in customer lifecycle metrics; the concept is defined in the customer lifecycle glossary entry.
Customer lifecycle marketing strategy by stage: goal, tactic, metric
| Stage | Goal | Tactic | Metric to watch |
|---|---|---|---|
| Acquire | Bring the right visitors | Source and campaign tracking with UTM tags; landing page per audience | Visitors by source; conversion rate by source |
| Activate | First meaningful action soon after sign-up | Welcome email within the hour; a three-step checklist | Share completing the first action within 7 days |
| Convert | First purchase | Remove checkout friction; recover abandoned carts | Checkout completion; cart recovery rate |
| Retain | Second and later purchases | Reorder reminders; usage tips triggered by behavior | Repeat purchase rate; retention by cohort |
| Win back | Bring lapsed customers back | A message after a lapse period set from your own reorder cycle | Reactivation rate |
| Advocate | Referrals and reviews | Ask right after a success moment | Referral rate |
Pick one stage to improve at a time. The next section shows how to choose it. If you only run one of these well, make it Retain: it is the stage where customers you already paid to acquire either pay back or leave.
| Stage | Goal | Tactic | Metric |
|---|---|---|---|
| Acquire | Right visitors | UTM-tagged campaigns; landing page per audience | Conversion rate by source |
| Activate | First meaningful action | Welcome email in an hour; three-step checklist | First action within 7 days |
| Convert | First purchase | Remove checkout friction; recover carts | Checkout completion |
| Retain | Repeat purchases | Reorder reminders; behavior-triggered tips | Repeat rate; cohort retention |
| Win back | Bring lapsed customers back | Message after your own lapse period | Reactivation rate |
| Advocate | Referrals and reviews | Ask after a success moment | Referral rate |
Work on one stage at a time, chosen from your own lifecycle counts.
What do you do before the first purchase?
Acquire. Tag every campaign link with UTM parameters so each visit is attributed to a source, campaign and medium. Without that, later stages cannot be tied back to what brought the customer in.
Convert. Checkout is where the most visible loss is. Baymard Institute's average cart abandonment rate across 50 studies from 2006 to 2025 is 70.22%. Its list of reasons for US shoppers puts extra costs first at 40%, then delivery too slow at 20%, no trust in the site with card details at 19%, a required account at 18% and a checkout that is too long or complicated at 17% (the page does not give the year or sample of that survey).
Sample data for a recovery email: 10,000 carts started in a month, 70.22% abandoned = 7,022 carts. A recovery email that wins back 5% of them yields about 351 orders, and at $60 an order, about $21,000 of revenue. Treat 5% as an assumption to replace with your own: send the email to half the abandoners at random and compare with the half who did not receive it.
Checkout fixes are cheaper than recovery emails because they work for every visitor, not only the ones with an email address on file.
What do you do right after the purchase?
Activate. The first goal after sign-up or first purchase is one meaningful action. Choose it from your own data: the action most common among customers who stayed for 90 days. Then send a single email that points only at that action, within the hour.
Retain. Two tactics carry most of the weight:
- Reorder reminders sized to the cycle. If customers typically reorder every 45 days, remind them at around day 40, not on day 10.
- Behavior-triggered tips. A tip about a feature the customer has not used, sent after a fixed gap, is more relevant than a monthly newsletter.
For email, Mailchimp's benchmarks page (data last updated December 2023) lists an all-users average click rate of 2.62% and unsubscribe rate of 0.22%; ecommerce is 1.74% click and 0.19% unsubscribe. Use those as a scale check, and measure your own program by repeat purchase, not clicks, because a click is not a reorder.
What do you do when customers drift away?
Win back. Define "lapsed" from your own cycle, not a generic number. If the median gap between orders is 45 days and 90% of customers reorder within 100 days, someone silent for 100 days is lapsed.
A win-back message works best when it says something new: a restock, a feature added since they left, or a question about why they stopped. Measure it as reactivation rate: lapsed customers who completed a meaningful action within 30 days of the message, divided by lapsed customers who got it. As with recovery emails, hold back a random group so you know how many would have returned without the message.
Advocate. Ask for a referral or a review right after a success moment (an order delivered on time, a problem solved). If you reward reviews, be careful: the US FTC's 2024 consumer review rule bans offering incentives conditioned on the sentiment of the review, whether the condition is explicit or implied.
Worked example: read the four lifecycle states to pick the stage to fix
You can read the health of the whole lifecycle from four counts per period. TapCub calls them New (first time seen this period), Returning (active last period too), Resurrecting (active earlier, not last period) and Dormant (active this period and gone in the next, drawn on the next period as a negative number). The current, unfinished period is never counted as dormant.
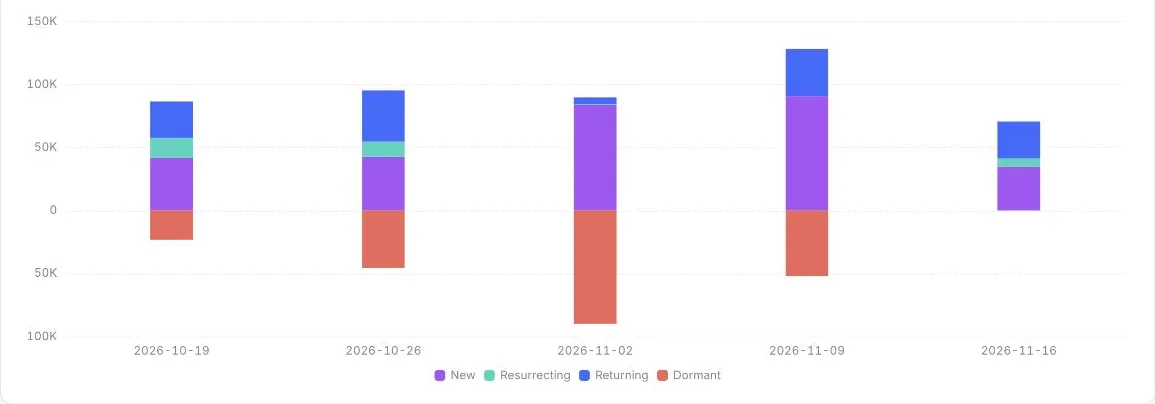
Sample data: weekly active customers of a store.
| Week 2 | Week 3 | |
|---|---|---|
| Returning | 650 | 600 |
| New | 300 | 280 |
| Resurrecting | 50 | 40 |
| Active this week | 1,000 | 920 |
| Dormant (active previous week, not this one) | −350 | −400 |
Week 1 had 1,000 active customers. Compute three things:
- Retention rate = returning ÷ previous week's active. Week 2: 650 ÷ 1,000 = 65.0%. Week 3: 600 ÷ 1,000 = 60.0%.
- Net change = new + resurrecting − dormant. Week 3: 280 + 40 − 400 = −80, which matches 920 − 1,000.
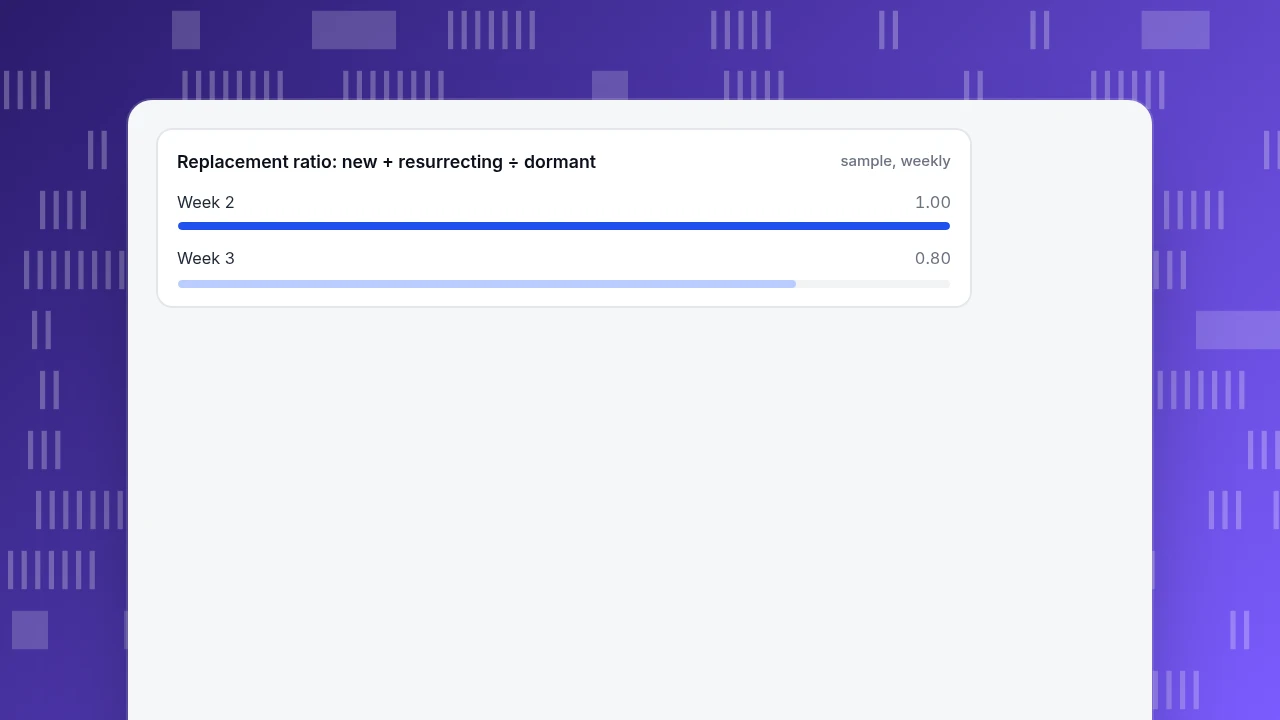
- Replacement ratio = (new + resurrecting) ÷ dormant. Week 2: 350 ÷ 350 = 1.00. Week 3: 320 ÷ 400 = 0.80.
A ratio of 1.00 means you replace exactly the customers you lose; below 1.00 the base shrinks. Week 3 fell below it, and the cause is visible: new customers dropped from 300 to 280, but the bigger movement is retention falling five points, from 65.0% to 60.0%. Restoring it to 65% would have kept 50 more customers (0.05 × 1,000), which is worth more than the 20 fewer new customers. So the stage to fix is Retain, not Acquire.
Replacement ratio: new + resurrecting ÷ dormant
sample, weeklyHow do you decide which stage to work on?
Use the four counts and apply the rules in order:
- Replacement ratio at or above 1.0 and retention stable: the base is healthy. Work on the stage with the best cost to improve, usually Convert or Activate.
- Replacement ratio below 1.0 and retention falling: fix Retain. Look at which cohort is leaving and at what age; tips and reorder reminders aim at that.
- Replacement ratio below 1.0 and retention stable: the problem is inflow. Check Acquire (traffic by source) and Convert (checkout).
- A large and growing Dormant pool with little Resurrecting: the issue is win-back; start with a lapse message to the most recent lapsers, because they respond best.
State the number you expect to move before you start, and review it after one full cycle. A 30-day trial on a product that people reorder every 45 days will not show a retention result.
What does a 90-day plan look like?
- Days 1 to 14. Define the first meaningful action, set UTM conventions and record the four-state counts as the baseline.
- Days 15 to 45. Launch one tactic for the stage the rules picked, with a random holdout.
- Days 46 to 75. Read the result against the holdout. Keep, change or drop.
- Days 76 to 90. Start a tactic for the next stage. Keep the first one running.
Do not launch six stages at once. You cannot tell which tactic moved which number, and each needs different content.
How to measure the lifecycle in TapCub
TapCub measures lifecycle states, retention, goals and sources, and runs live chat. It does not send lifecycle emails, build journeys, score leads or run experiments; send and split in your own tools and measure the result here.
- Read the four states. In All-platform analytics › Behavior › Behavior analysis open the lifecycle view, switch between weekly and monthly, and note New, Returning, Resurrecting and Dormant, the same four states as the example. Compute the retention rate and replacement ratio from them.
- Watch retention by cohort. The same page's Retention view shows how many customers in a group come back in each later period, so you can see at what age customers leave.
- Tag acquisition. Campaign links with UTM parameters appear in Web analytics › Sources; set a goal in Web analytics › Goals for the purchase or sign-up.
- Recognize customers across stages. Call
tapcub.loginso logged-in customers show up in All-platform analytics › Users › People, and use Segments & tags (rule segments update daily) to build a lapsed or new-customer group. - Mark each launch. Add a date annotation in Configuration › Annotations when a tactic starts, so the lifecycle chart shows what changed and when.
FAQ
What is customer lifecycle marketing?
Planning messages, offers and product experience around a customer's stage, from first visit through repeat purchase to lapse and win-back. Each stage has one goal and one metric, so you can see what is working.
What are the stages of the customer lifecycle?
A common set is acquire, activate, convert, retain, win back and advocate. Google Analytics reports on four: Acquisition, Engagement, Monetization and Retention.
How do you measure the customer lifecycle?
Count customers in four states per period: new, returning, resurrecting and dormant. From them compute retention rate (returning ÷ previous active) and replacement ratio ((new + resurrecting) ÷ dormant).
What is a good replacement ratio?
At least 1.00 means you replace the customers you lose. In the sample, week 3 was 0.80 and the base shrank by 80. This is a rule we use, not a published benchmark.
How long before lifecycle marketing shows results?
At least one full reorder cycle. If customers reorder every 45 days, a 30-day test cannot show retention changes.
Sources
- Google Analytics Help, "[GA4] The Life cycle collection of reports" (Acquisition, Engagement, Monetization and Retention reports): support.google.com
- Baymard Institute, "Cart abandonment rate statistics" (average 70.22% across 50 studies from 2006 to 2025; reasons for US shoppers; checked 2026-11-20): baymard.com
- Mailchimp, "Email marketing benchmarks" (average click 2.62% and unsubscribe 0.22%; data updated December 2023): mailchimp.com
- US Federal Trade Commission, press release on the final rule on consumer reviews and testimonials (14 August 2024): ftc.gov
Was this article helpful?
We use your answers to fix and expand this page.
Couldn’t send. Please try again in a minute.
Thanks for the feedback. We’ll use it to improve this page.You’ve already sent feedback on this page. Thanks.

Product Analyst
Focuses on event analysis, conversion funnels, and retention, using clear metric definitions and structured analysis to explain product performance.