Try it on your own data
Every report in this article is in the free plan. One snippet for web and apps, up to 10 sites.
Start freeNews analytics for a publisher means measuring readers, not news text: whether they finish the article, where they came from and whether they return. Pageviews count loads, not reads, so track read-through, engaged rate, source mix, returning share, onward pages and search clicks instead.
What you will learn
- The finance meaning of news analytics measures text; this page is about measuring readers
- In the sample, an article with 4.2 times the pageviews had only 1.22 times the completed reads (50,000 × 12% vs 12,000 × 41%)
- Split read-through by source: newsletter readers finished at 35.0%, social at 9.0%; judge each source by its own job
What news analytics means here
"News analytics" has two meanings, and search results mix them. In finance, it means measuring the text of news stories, such as sentiment, relevance and novelty, to feed trading and risk models. This page is about the other one: measuring how readers use a news or content site, which is what editors, publishers and site owners do. It covers who reads, how far, where they came from and whether they return. It does not cover advertising revenue, which comes from your ad stack, not from site analytics.
Newsrooms have been developing this for years. The Reuters Institute's report on editorial analytics, based on more than 30 interviews with people who build analytics in news organisations, looks at what a sophisticated analytics strategy involves and why many organisations still take a basic approach. The basic approach is usually counting pageviews. The rest of this article explains why that is not enough and what to track instead.
Six indicators for a news or content site
Six numbers cover most editorial questions. Each answers a different question, and none needs a complex setup. The table in this article lists them with the way each is counted and where to find it in TapCub.
- Read-through. What share of readers reach the end of the article? Scroll reach is the usual proxy.
- Engaged rate. What share of sessions were more than a glance? Google Analytics defines an engaged session as one that lasts longer than 10 seconds, includes a key event or has two or more page views, and TapCub uses the same thresholds.
- Source mix. Where do readers come from: search, social, newsletter, direct, AI assistants?
- Returning share. How many readers came back?
- Onward pages. After this article, do readers go to another page on the site?
- Search performance. For articles that rank, how many impressions become clicks?
A seventh candidate, time on page, is easy to over-trust. A reader who leaves a tab open inflates it, and a reader who skims a short article quickly and gets what they need looks like a failure. Use it as supporting evidence next to read-through, not as the headline. For a longer comparison of time measures, see average session duration.
| Indicator | What it answers | How it is counted | Where in TapCub |
|---|---|---|---|
| Read-through | Do readers reach the end? | Share of visits reaching the end of the page (scroll reach) | All-platform analytics › Behavior › Heatmaps (Scroll reach) |
| Engaged rate | Was it more than a glance? | Sessions of 10+ seconds, 2+ pageviews or a key event | Web analytics › Reports |
| Source mix | Where do readers come from? | First source of session: search, social, newsletter, direct, AI | Web analytics › Sources |
| Returning share | Do they come back? | Returning visitors ÷ visitors | Web analytics › Audience |
| Onward pages | Do they go on to another page? | Downstream pageviews in the same session | Web analytics › Pages |
| Search performance | Do rankings become clicks? | Impressions, clicks, click-through rate, position | Monitoring › Search performance |
Pageviews and time on page are supporting numbers; advertising revenue comes from your ad platform, not site analytics.
Why pageviews are not the target
A pageview records that a page loaded, not that anyone read it. Two articles can have the same pageviews and very different value.
Sample data: two articles in the same week.
| Article | Pageviews | Average read-through | Completed reads |
|---|---|---|---|
| A: a curiosity headline | 50,000 | 12% | 6,000 |
| B: a detailed explainer | 12,000 | 41% | 4,920 |
Article A has more than four times the pageviews (50,000 ÷ 12,000 = 4.2). But it has only 22% more completed reads: 6,000 ÷ 4,920 = 1.22. Per pageview, B holds readers more than three times better: 41% ÷ 12% = 3.4.
What to do with the numbers depends on what the article is for:
- If the goal is reach, A did its job, and the headline is worth studying.
- If the goal is trust and return visits, B's 41% is the better sign, and the question is how to get more readers to B.
- If A was promoted heavily, check the source mix before concluding anything. Social visitors often read less, and that is expected, not a defect.
Completed reads are a count you can compare across articles; read-through is the rate. A reach story and a depth story need different targets, so set one per article type.
A worked example: where readers drop out
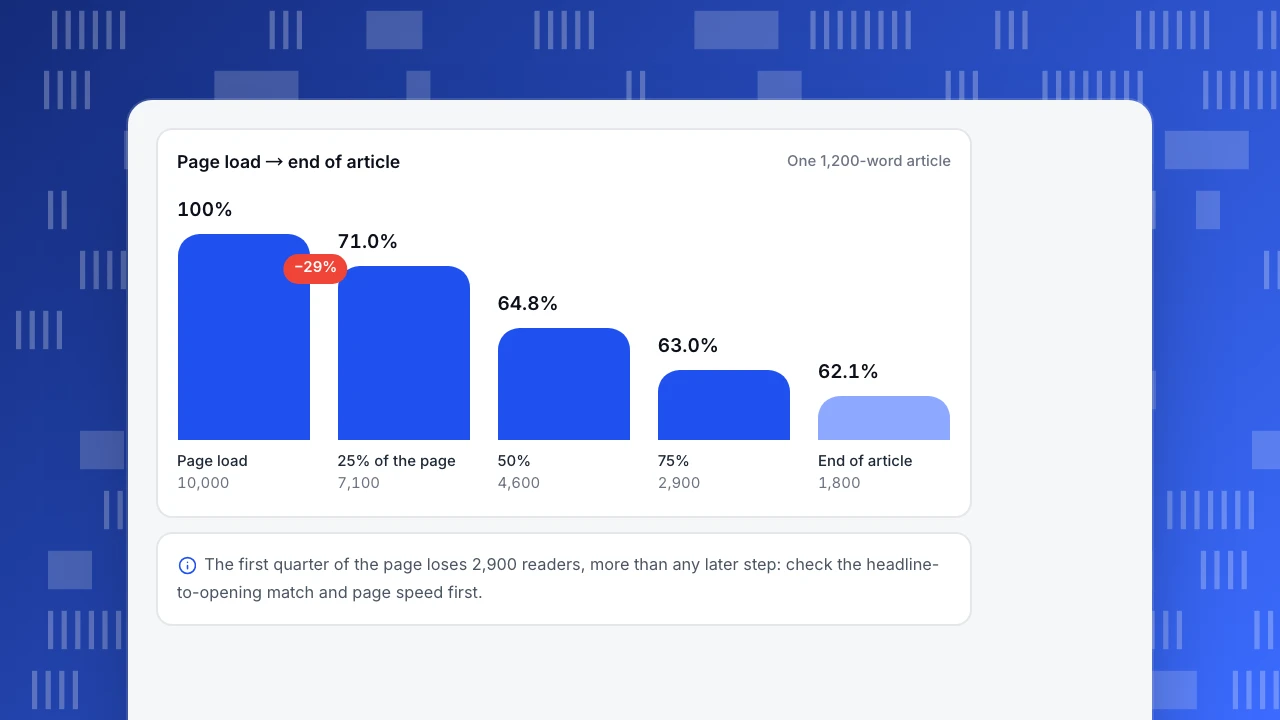
Sample data: 10,000 pageviews on one 1,200-word article, with scroll reach measured at four points.
| Reached | Readers | Share of pageviews | Kept from previous point |
|---|---|---|---|
| Page load | 10,000 | 100% | n/a |
| 25% of the page | 7,100 | 71% | 71.0% |
| 50% | 4,600 | 46% | 64.8% |
| 75% | 2,900 | 29% | 63.0% |
| End of article | 1,800 | 18% | 62.1% |
Read-through is 1,800 ÷ 10,000 = 18%. The step from page load to 25% loses the most readers in absolute terms (2,900), which points at the opening: a headline that promised something the first paragraph did not deliver, a slow page, or a large image pushing the text down. The later steps each keep a bit above 60%, which is a steady loss that suggests the article is long for what it offers rather than broken at one point.
Rules for reading a scroll chart:
- If the biggest loss is before the first 25%, fix the headline-to-opening match and page speed before touching the body.
- If there is a cliff at one point, look at what sits there: an embedded video, a signup box, an ad block, a section break.
- If the loss is steady, test a shorter version or move the key information up.
- Compare articles of similar length. A 400-word news brief and a 3,000-word feature will not have the same read-through, and that is not a problem.
A reader at 100% did not necessarily read every word, and scroll depth does not measure comprehension. It is a proxy. Use it to rank articles against each other, not as an absolute truth. The glossary page on scroll depth covers the definition, and engaged session explains the engaged-rate threshold.
Page load → end of article
One 1,200-word articlePage load
10,000
25% of the page
7,100
50%
4,600
75%
2,900
End of article
1,800
Read-through by source: who reads, not just how many
The same article performs differently for different readers. Splitting read-through by source tells you which audiences your content actually serves.
Sample data: the same 10,000 pageviews, split by first source.
| Source | Pageviews | Reached the end | Read-through |
|---|---|---|---|
| Search | 4,000 | 800 | 20.0% |
| Social | 2,500 | 225 | 9.0% |
| Newsletter | 1,500 | 525 | 35.0% |
| Direct | 1,700 | 170 | 10.0% |
| AI assistants | 300 | 80 | 26.7% |
| All | 10,000 | 1,800 | 18.0% |
The pieces add up: 800 + 225 + 525 + 170 + 80 = 1,800. Newsletter readers finish at four times the rate of social readers (35.0% ÷ 9.0% = 3.9).
How to use this:
- If a source sends many readers who leave early, do not judge it on read-through alone. Social is often a discovery channel; judge it on returning readers or newsletter signups it produces.
- If the highest read-through comes from a small source, such as the newsletter here, grow that source before optimizing the weak ones.
- If AI assistants send few visits but they read deeply, as in the sample, that is a signal about intent, not scale. Do not draw conclusions from 300 pageviews.
Do readers come back?
For a news or content site, repeat readers are the audience you can build on. A site that gains new visitors and loses returning ones is renting its audience.
Sample data: a month with 12,000 readers and 36,000 pageviews.
| Group | Readers | Pageviews | Pageviews per reader |
|---|---|---|---|
| Returning | 3,000 | 14,400 | 4.8 |
| New | 9,000 | 21,600 | 2.4 |
| All | 12,000 | 36,000 | 3.0 |
Returning readers are 3,000 ÷ 12,000 = 25% of readers and 14,400 ÷ 36,000 = 40% of pageviews. They read twice as many pages each (4.8 ÷ 2.4). Track the returning share month by month: a rise from 25% to 30% matters more than a spike in new visitors from one viral story.
Returning-reader numbers depend on recognizing the same reader across days. If your analytics changes the visitor identifier every day for privacy, the figure is unavailable or understated. Check how your tool identifies visitors before comparing months.
How to see AI-driven traffic
Two different things are called AI traffic, and mixing them gives wrong answers.
- People sent by an AI assistant. A reader asked a question, an assistant cited your article, and the reader clicked. These are human visits with an AI referrer.
- Crawlers that read your pages. AI training bots and answer engines request pages without a human. They show up in server and bot reports, not in your reader counts.
The Reuters Institute's Digital News Report 2025 says 7% of respondents use AI chatbots for news each week, rising to 15% of those under 25. The numbers are small overall, but they explain why publishers want to see both lines.
Sample data: in one month AI crawlers made 42,000 requests to your articles and AI assistants sent 280 human visits. That is 42,000 ÷ 280 = 150 reads per visit. A ratio like this is a fact about how your content is being used, not a verdict on whether to allow or block crawlers; that decision depends on your licensing and traffic goals. For the ledger, see AI crawler ledger.
Report the two separately every month: human visits from AI assistants, and crawler reads by operator.
Search performance: articles that rank but do not get clicked
For many content sites, search is the largest source. Impressions, clicks, click-through rate and average position come from the search engine's own console, not from visits.
Sample data: an article with 12,000 impressions, average position 6.2 and a 1.8% click-through rate: 12,000 × 0.018 = 216 clicks. The site's median click-through rate for articles at similar positions is 3.5%, which would give 420 clicks. The gap is 204 clicks a month, and the cheapest fix is the title and description, not new content.
Rule: if an article ranks in the top 10 but its click-through rate is below your median, rewrite the title and description first. If it ranks lower than 10, improving the article itself is the next step. For the content side of search, see content performance metrics.
Common mistakes in news analytics
- Treating pageviews as the goal. They count loads, not reads.
- Judging every source on read-through. Different sources do different jobs.
- Comparing articles of different length. Compare like with like.
- Counting bots as readers. Crawlers inflate pageviews and depress every rate.
- Reading time on page as attention. Open tabs and fast skimmers both distort it.
- Mixing AI crawlers with AI referrals. One is machine reads, the other is people.
- Mixing audience data with revenue data. Site analytics tells you who reads; your ad platform tells you revenue. Use both, side by side.
See this in TapCub
Take the 10,000-pageview article above.
- Turn on scroll measurement. Scroll depth is off by default. In the autocapture card under Web analytics › Configuration › SDK code, enable Scroll depth (autocapture needs the Pro plan or higher); how to set it up is in track scroll depth. Then open All-platform analytics › Behavior › Heatmaps and pick the page to see Scroll reach: each row is the share of visits that reached that depth or further, and the page list shows average maximum scroll depth. Rows are merged by path template, so articles under one URL pattern appear as one row.
- Check the engaged rate and onward pages. Web analytics › Reports shows engaged rate (sessions of at least 10 seconds or two pageviews, or a hit on a key event), and Web analytics › Pages has time on page, bounce, entries, exits and downstream pageviews, the pageviews later in the same session.
- Split by source. Web analytics › Sources has Channels, Referrers, Search engines, AI sources and UTM tabs, each with visitors, sessions, pageviews, bounce and duration (sources and UTM). AI sources counts people sent by AI products.
- Compare new and returning readers. Web analytics › Audience puts new and returning visitors side by side. This needs the default balanced privacy mode; strict mode changes the salt every day and hides the comparison.
- Check crawlers separately. Web analytics › Bots keeps AI and other crawlers out of reader counts and has an AI content ledger showing reads against visitors sent back (read the AI crawler ledger).
- Connect search. After connecting Google Search Console or Bing Webmaster in Monitoring › Search performance, you see clicks, impressions, click-through rate and position by page, and pages in the top 10 with below-median click-through are flagged. Data arrives one to three days late.
TapCub does not report advertising revenue or run an ad stack; it tells you who reads.
FAQ
What is news analytics?
It has two meanings. In finance, it measures the text of news stories, such as sentiment, relevance and novelty, for trading and risk. For publishers and site owners, it means measuring how readers use a news site: read-through, source mix, returning readers and search performance. This article is about the second.
What metrics matter for a news website?
Six cover most questions: read-through (scroll reach to the end), engaged rate, source mix, returning-reader share, onward pages and search performance. Pageviews and time on page are supporting numbers. Track them per article type, because a short brief and a long feature will never share the same read-through.
How do publishers measure engagement?
Publishers combine scroll reach, engaged sessions, returning readers and subscriber or signup actions. An engaged session in Google Analytics is one that lasts more than 10 seconds, includes a key event or has at least two page views. Scroll reach to the end of the article is the usual proxy for reading it.
Are pageviews still useful for a news site?
Yes, as a reach number and as a denominator for rates. They are misleading as a goal, because they count loads, not reads. In the sample, an article with four times the pageviews had only 22% more completed reads. Pair pageviews with read-through and returning share.
How do I track traffic from AI assistants?
Separate people from crawlers. Human visits whose referrer is an AI product show up as an AI source in your sources report. Crawler reads show in a bot report. Compare them monthly, for example as reads per visit (42,000 ÷ 280 = 150 in the sample), and do not add them together.
Sources
- Wikipedia, News analytics (measurement of attributes of news text such as sentiment, relevance and novelty, used in finance). Checked 2026-11-18.
- Reuters Institute, Digital News Report 2025: Executive summary (7% weekly AI chatbot use for news, 15% of under-25s). Checked 2026-11-18.
- Reuters Institute, Editorial analytics: how news media are developing and using audience data and metrics (Cherubini and Nielsen; 30+ interviews). Checked 2026-11-18.
- Google, Engagement rate and bounce rate (GA4) (engaged session thresholds). Checked 2026-11-18.
Was this article helpful?
We use your answers to fix and expand this page.
Couldn’t send. Please try again in a minute.
Thanks for the feedback. We’ll use it to improve this page.You’ve already sent feedback on this page. Thanks.

Data Analyst
Explores traffic sources, conversion funnels, and retention, using clear metric definitions and concrete examples to explain what the numbers mean.