Try it on your own data
Every report in this article is in the free plan. One snippet for web and apps, up to 10 sites.
Start freeMobile testing tools are best sorted by the question they answer: does it work, does it work on their devices, is it fast and stable, and what do real users hit after release. The first three run before a version ships; the fourth, real-user data, is the only one that sees what actually happened. Below: the four kinds, a worked release comparison and a before-and-after checklist.
What you will learn
- Pick tools by the question they answer, not from a ranked list: function, compatibility, performance, real users
- Choose test devices from your own active-user shares: six models covered 81% and eight covered 90% in the sample
- Compare releases by crash rate per version and per device; a 2.0% aggregate hid one model at 15.0%
Which kind of mobile testing tool answers which question?
Lists of mobile testing tools mix products that answer very different questions. Sort them by the question instead. Android's own testing guide splits tests by subject into functional, performance, accessibility and compatibility; add what real users do after release, and you have four questions that need four kinds of tool.
| Question | Kind of tool | When it runs | What it cannot tell you |
|---|---|---|---|
| Does it do what it should? | Unit, integration and UI test frameworks, run locally or on a device | Every commit and before release | Whether anyone uses the feature, or whether it works on a phone you did not test |
| Does it work on their devices? | Emulators, device labs and beta channels | Before release, on a device matrix | How many of your users are on each device |
| Is it fast and stable? | Profilers, load and startup benchmarks | Before release and on release candidates | Behaviour on real networks, real battery levels and real data |
| What do real users do and hit? | App analytics: crashes, errors, versions, events, funnels | After release, continuously | Why a bug happens; it shows where and for whom |
The first three kinds are the ones most lists cover. They run before the version reaches users. The fourth kind is the only one that sees what happened after release, and it is the one that tells you whether the first three were enough. This guide takes them in order, then gives a before-and-after checklist and a worked release comparison. If your question is whether people can use the app, that is usability testing, covered in mobile app usability testing.
Functional testing: does the app do what it should?
Functional tests check behaviour: tap Continue, expect the Welcome screen. Android's testing fundamentals describe three sizes. A small (unit) test checks a method or class, a medium test checks two or more units together, and a big (end-to-end) test checks a whole screen or user flow. They also distinguish where tests run: local tests run on your development machine, instrumented tests run on a physical or emulated device.
Three decision rules keep this layer cheap:
- If a rule can be tested without a screen, test it without a screen. Pricing, validation and state logic belong in small local tests. They run in seconds and rarely flake.
- Keep the big device tests for the money paths. Sign-up, login, checkout and the one feature you sell. Android's guide notes that code which cannot be isolated forces bigger, slower, flakier tests, which is the argument for testable structure.
- Automate what you repeat; explore what is new. Manual testing scales poorly and misses regressions, as the same guide says, but a new feature still needs a person trying odd inputs once before you write the script.
What this layer cannot do is tell you which flows matter. That comes from usage data. If 2% of sessions ever reach a settings screen, a long device test for it is lower priority than a test for the flow 60% of sessions use.
Compatibility testing: which devices are worth testing on?
You cannot test every phone, so choose the matrix from your own users, not from a generic list. Rank device models and OS versions by active users and add rows until you cover the share you want.
Sample data: a store app's active users by device model over 30 days.
| Model | Share of active users | Cumulative |
|---|---|---|
| Model A | 22% | 22% |
| Model B | 18% | 40% |
| Model C | 14% | 54% |
| Model D | 11% | 65% |
| Model E | 9% | 74% |
| Model F | 7% | 81% |
| Model G | 5% | 86% |
| Model H | 4% | 90% |
| Everything else | 10% | 100% |
Six models cover 81% of users and eight cover 90%. The last 10% is a long tail of many models, none above about 1% in this sample, so extra devices add little. Two rules follow:
- Start with the models that cover about 80–90% of users, then add risky ones. Risky means oldest supported OS version, smallest screen, lowest memory, plus any model with a crash history.
- Add by evidence. When a crash cluster shows up on one model in production, add that model to the matrix and keep it there.
OS version works the same way: list versions by active users, test the newest, the oldest you support, and the most common in between. Whether your analytics can report device model, OS version, resolution and network depends on what the SDK collects, so check that the fields arrive before relying on them.
Performance testing: is it fast and stable enough?
Performance tests check speed, memory and responsiveness before users feel them. Pick budgets before you test, otherwise every result is "looks fine".
- Startup time. Measure cold start (the process starts from nothing) separately from hot start, on a low-end device, not your development phone.
- Responsiveness. On Android, an app not responding (ANR) is triggered when it has not responded to an input event within 5 seconds, so any main-thread work near that range is a defect, and much shorter freezes are already visible to users.
- Memory. Low-memory devices are where out-of-memory crashes appear; Android's crash guide suggests testing with a low-memory emulator when you see them.
- Network. Users move in and out of coverage. The same guide says network exceptions are normal operating conditions, so test airplane mode and slow links, and check the app degrades instead of crashing.
For a reference point on what counts as bad, Google Play publishes thresholds for its own Android vitals: a user-perceived crash rate of 1.09% of daily users overall, or 8% on a single phone model, and a user-perceived ANR rate of 0.47% overall, or 8% on a single model. Those are measured over 28 days and use Google's own definitions, so treat them as context for your numbers, not as a target your analytics will match.
Lab performance testing has a blind spot: it uses your devices, your network and your data. A release can pass every benchmark and still be slow for the 8% of users on one model with a full storage drive. That gap is what the fourth kind closes.
Real-user data: what happened after release?
After release, the question changes from "does it work?" to "how many people hit a problem, on which version and device?". Counts mislead here because a new version starts with few users. Use rates: crash users divided by active users, per version.
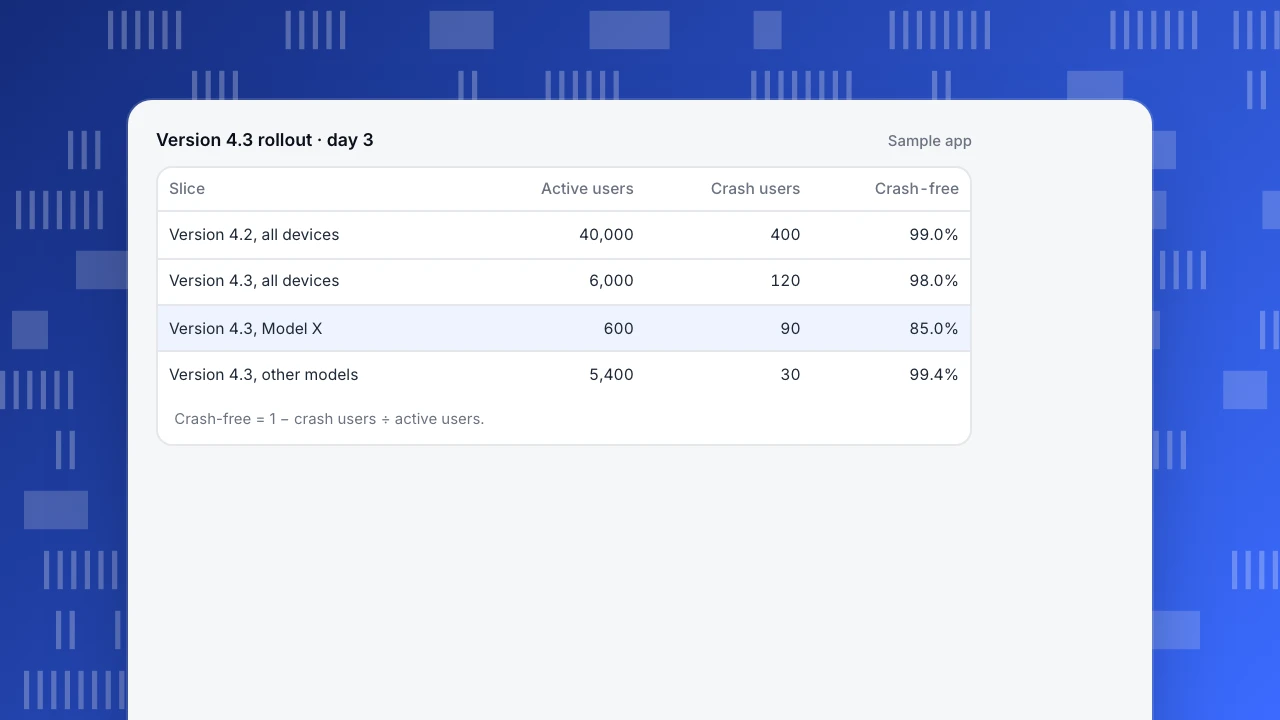
Sample data: version 4.3 is rolled out gradually. After three days it has 6,000 active users; version 4.2 has 40,000 over the same week.
| Slice | Active users | Crash users | Crash-free share |
|---|---|---|---|
| Version 4.2, all devices | 40,000 | 400 | 99.0% |
| Version 4.3, all devices | 6,000 | 120 | 98.0% |
| Version 4.3, Model X | 600 | 90 | 85.0% |
| Version 4.3, all other models | 5,400 | 30 | 99.4% |
The crash-free share is 1 − crash users ÷ active users. For 4.3: 120 ÷ 6,000 = 2.0%, so 98.0% crash-free, against 1.0% for 4.2. The gap is 1.0 percentage point. A standard two-proportion check gives a standard error of 0.19 points, so the 95% interval for the difference is about 0.63 to 1.37 points: this is not noise.
Now slice by device. Model X has 600 users and 90 crash users, or 15.0%. Every other model together has 30 crash users out of 5,400, or 0.56%, which is better than 4.2's 1.0%. The release is not broadly worse; one model is badly broken. The fix is a hotfix or a staged-rollout halt for that model, not a rollback of everything. The aggregate number alone would have sent you to the wrong decision.
Startup time reads the same way: if the median cold start moves from 1.8 s to 2.6 s, that is 44.4% slower, and you check whether it is everywhere or on older devices only.
What to check before and after each release
| When | Check | Pass rule (example) |
|---|---|---|
| Before | Small and medium tests on every commit | All green on the release branch |
| Before | Device tests on the money paths | Pass on the matrix covering about 80–90% of users |
| Before | Startup and memory on the lowest supported device | Within the budget you set |
| Before | Analytics events fire with required properties | Each planned event arrives with its required fields |
| Rollout day 1–3 | Crash-free share by version and by device | New version within about 0.5 point of the old one overall; no single model far worse |
| Rollout day 1–3 | Custom errors and funnel steps for the new flows | No step has dropped against the previous version |
| Day 7 | Retention and median startup versus previous version | No unexplained drop |
| Any time | One model or OS version far worse than the rest | Halt the rollout for that slice, then fix |
Treat the 0.5 point in the pass rule as a starting rule of thumb you tune to your own history, not a standard. What matters is that you wrote the rule before the release.
Common mistakes in choosing and using mobile testing tools
- Treating a long list of tools as a coverage plan. Coverage is about questions answered, not products used. Check each of the four questions has an owner.
- Reading crash counts instead of crash rates. The old version always has more crashes because it has more users.
- Averaging across devices. The worked example shows a 2.0% aggregate hiding one model at 15.0%. Always slice by device and OS.
- Testing on the newest phones. The lab has the fast phone; your users do not all have one.
- Skipping analytics validation. If a new screen sends no events, the funnel looks like a drop. Verify events before blaming users.
- Expecting analytics to replace tests. It tells you something broke after users met it; tests stop it before they do.
How to do the post-release half in TapCub
TapCub is not an automated testing tool: it does not run test scripts, rent devices or profile code. It covers the fourth question and part of the third, once real users have the build. Here is the 4.3 rollout above, in the console:
- Before release, plan the events. In All-platform analytics › Data › Tracking plan, list the events the new flow should send, with required properties and status. After a test build runs, switch on real-time validation (last 24 hours) to see whether each event arrived and whether its required properties are complete.
- On rollout day 1, open the version table. App analytics › Users › Versions lists each version with its share of active users, crash count and first-seen date. TapCub also adds a release marker on trend charts the first day a version appears, so later changes line up with it.
- Read the crash-free share. App analytics › Quality & attribution › Stability shows the crash-free share (1 − crash users ÷ active users), ANRs, UI freezes, starts and median cold start, hot start and memory. Use the header filter to narrow to 4.3, then compare with 4.2.
- Slice by device. App analytics › Quality & attribution › Devices breaks users down by model, OS version and more, ordered by active users. Combine it with the Stability filter to find the model that crashes. Which device fields appear depends on what each SDK collects.
- Handle errors in groups. Error groups can be marked active, resolved or ignored. Business errors your app sends as custom errors are counted on their own tab and do not change the crash-free share.
TapCub does not stop a rollout for you or fix anything; it shows where and for whom. Pair it with the release controls of your store and your own pipeline. For wider app metrics, see mobile app KPIs; for versions and release tracking, see app versioning and improve app performance. For what lab-style probing of a live site looks like, see synthetic monitoring.
FAQ
What are mobile testing tools?
They are software that checks a mobile app before and after release. In practice they fall into four kinds: functional test frameworks, compatibility labs and emulators, performance profilers and benchmarks, and real-user analytics for crashes, versions and events. Each answers a different question, so one product rarely covers all four.
Which mobile testing tools do I need first?
Start with small automated tests for your core logic, one device test per money path, and crash reporting with version and device filters. That covers the two questions that hurt most: did we break something, and did a release break it for real users. Add device labs and performance benchmarks as the app and audience grow.
How many devices should I test on?
Enough to cover most of your actual users. In the sample above, six models covered 81% and eight covered 90%. Rank your own device models by active users, stop where extra devices add little, then add the oldest supported OS and any model with a crash history.
What is a good crash-free rate?
There is no single number. Google Play flags apps with a user-perceived crash rate above 1.09% of daily users overall or 8% on one model, but definitions differ between tools. Compare each release with your previous release and watch for any single model far worse than the rest.
Is manual testing still needed?
Yes, for new features, usability, and odd inputs. Android's guidance says manual testing scales poorly and misses regressions, so automate what you repeat. Use people for exploration and judgment, and use real-user data to confirm that what passed in the lab also works in the field.
Sources
Was this article helpful?
We use your answers to fix and expand this page.
Couldn’t send. Please try again in a minute.
Thanks for the feedback. We’ll use it to improve this page.You’ve already sent feedback on this page. Thanks.

Customer Experience Consultant
Writes about live chat, visitor conversations, and self-service, sharing practical ways to make customer communication clearer and more effective.