Try it on your own data
Every report in this article is in the free plan. One snippet for web and apps, up to 10 sites.
Start freeA metrics dashboard works when its numbers sit in three layers: one north star that says whether customers get value, three to five input metrics that add up to it, and a few guardrails that must not get worse. Piling 30 equal tiles on one screen hides which number matters. Below: the layers, a recomputable example and a layout.
What you will learn
- Write the formula that turns inputs into the north star, or the dashboard cannot explain a change
- Set a threshold for every guardrail in advance so a breach triggers a review
- Keep to eight or ten numbers on the first screen and put detail behind a click
What is a metrics dashboard, and what should it contain?
A metrics dashboard puts the numbers you manage by on one screen, over time, so that a change is visible at a glance. The hard part is not drawing it; it is choosing which numbers and where to put them. The rule that works is to arrange them in three layers, each with a different job:
| Layer | Its job | How many | Example | Review rhythm |
|---|---|---|---|---|
| North star | The one number that says whether customers get value | 1 | Weekly revenue | Weekly |
| Inputs | The levers that add up to the north star | 3 to 5 | Sessions, conversion rate, average order value | Weekly, with owners |
| Guardrails | What must not get worse while you chase the others | 2 to 4 | Error rate, page speed, bounce rate | Daily alert, weekly review |
Putting everything on one level is the usual failure. A wall of 30 equal tiles hides which number matters, which ones you can move and which ones signal damage. For the wider family of dashboards (executive, marketing, product) see analytics dashboard; for the KPIs behind a business, see business metrics. This article is about the arrangement.
| Layer | Its job | How many | Example |
|---|---|---|---|
| North star | Says whether customers get value | 1 | Weekly revenue |
| Inputs | Levers that add up to the north star | 3 to 5 | Sessions, conversion rate, order value |
| Guardrails | Must not get worse | 2 to 4 | Error rate, page speed, bounce rate |
Each input has one owner and one lever.
Layer 1: how do you choose the north star metric?
The north star is a single metric that moves when customers get more value and, with a delay, when revenue grows. Test any candidate against three questions:
- Does it measure value delivered, not effort or vanity? Orders completed pass; pageviews do not.
- Does it lead revenue, or at least track it? If it can rise while revenue falls, it is the wrong number.
- Can several teams move it? A number that only one person can influence is a team metric, not the headline.
If you cannot pick one, pick the one a new employee would understand in ten seconds. More background is in north star metric. For the sample store below, the north star is weekly revenue, which fits all three tests.
Layer 2: how do the input metrics add up to the north star?
Inputs are the factors you multiply or add to get the north star. Writing the formula is the step most dashboards skip, and it is what makes the layer actionable. For an online store:
Weekly revenue = sessions × conversion rate × average order value
Sample data for a normal week: 40,000 sessions × 2.5% = 1,000 orders; 1,000 orders × $60 = $60,000.
Each input has one owner and one lever:
| Input | Owner | Lever |
|---|---|---|
| Sessions | Marketing | Campaigns, content, partnerships |
| Conversion rate | Product or site team | Landing pages, checkout, speed |
| Average order value | Merchandising | Bundles, thresholds, pricing |
If you need to go deeper than three inputs, build a tree instead of adding tiles; metric tree shows how to break each input into its own drivers. Keep the dashboard to the first level and put the tree behind a click.
Layer 3: what are guardrail metrics and which ones belong here?
A guardrail is a number that must not get worse while you improve the others. It exists because every input can be pushed up in a way that damages something else: a discount raises conversion and lowers margin; a heavy script raises engagement and slows the page.
Pick guardrails by asking what you would be embarrassed to find out later:
- Reliability: the error rate (errors ÷ pageviews) and the share of visits that hit an error.
- Speed: the 75th percentile of Largest Contentful Paint. Google's guidance treats 2.5 seconds or less as good.
- Engagement damage: bounce rate on the landing pages you are driving traffic to.
- Business damage: whichever cost or complaint number applies to you, such as refund rate or support tickets per 100 orders.
Give each guardrail a threshold in advance. A guardrail without a threshold is just another tile; with one, it becomes an alert. Google's site reliability guidance on monitoring makes the same point for services: watch the signals that tell you users are being hurt, not every number you can collect.
Worked example: what does a promotion week look like across the three layers?
Sample data: the same store runs a promotion for a week.
| Measure | Normal week | Promotion week | Change |
|---|---|---|---|
| Sessions | 40,000 | 48,000 | +20.0% |
| Conversion rate | 2.50% | 2.20% | −0.30 pts (−12%) |
| Orders | 1,000 | 1,056 | +5.6% |
| Average order value | $60 | $60 | 0% |
| Revenue (north star) | $60,000 | $63,360 | +5.6% |
| Error rate | 0.6% | 1.4% | +0.8 pts |
| Errors (3 pageviews per session) | 720 | 2,016 | +180% |
Recomputed: 48,000 × 2.2% = 1,056 orders; 1,056 × $60 = $63,360; 63,360 ÷ 60,000 = 1.056. The growth factors multiply: 1.20 × 0.88 × 1.00 = 1.056. Errors: 120,000 pageviews × 0.6% = 720 and 144,000 × 1.4% = 2,016.
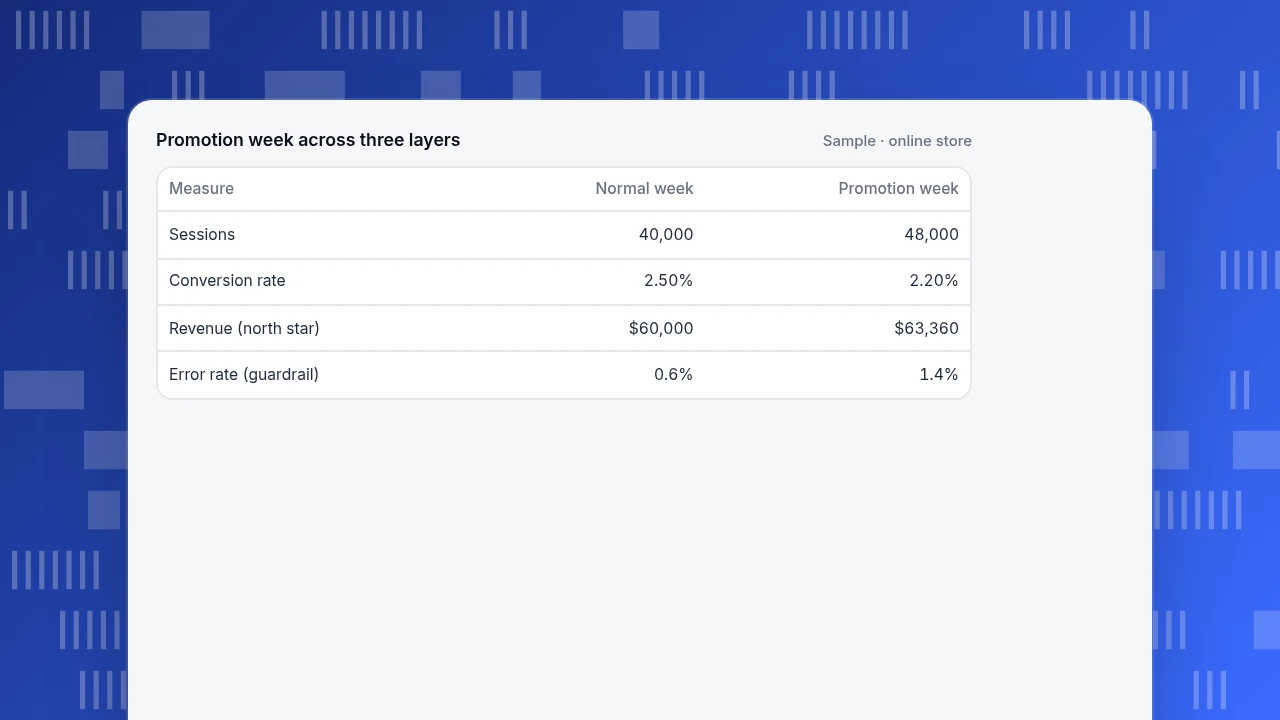
On a dashboard with only the north star, the week looks like a modest success. With all three layers, it reads differently: traffic rose 20%, but the conversion rate fell and a guardrail tripped. If the conversion rate had held at 2.5%, the same traffic would have produced 1,200 orders and $72,000, so roughly $8,640 was lost. The error rate more than doubled in the same week, which is the first thing to investigate before the next promotion. The three layers turn "+5.6%" into "the campaign worked on reach and broke something on the site".
Promotion week across three layers
Sample · online store| Measure | Normal week | Promotion week |
|---|---|---|
| Sessions | 40,000 | 48,000 |
| Conversion rate | 2.50% | 2.20% |
| Revenue (north star) | $60,000 | $63,360 |
| Error rate (guardrail) | 0.6% | 1.4% |
How do you lay out the screen?
A layout follows the layers from top to bottom:
- Top: the north star as a large number with its trend and a comparison with the previous period.
- Middle: the inputs in a row, each with its owner's name and the same comparison.
- Bottom: the guardrails with their thresholds shown and a visible state when breached.
Then four rules: eight to ten numbers in total; one definition caption under each tile; the same comparison period everywhere; and annotations for releases and campaigns on the trend line, so a bump is explained when someone sees it later.
Each tile should have a one-line specification so it can be audited:
| Field | Example |
|---|---|
| Name | Conversion rate |
| Definition | Orders ÷ sessions, for the date range |
| Owner | Site team |
| Threshold | Review if below 2.2% |
| Comparison | Previous period |
How do you build a metrics dashboard in five steps?
- Name the north star and write its formula.
- Break it into three to five inputs and assign one owner to each.
- Choose two to four guardrails and set a threshold for each.
- Write the tile specification (definition, owner, threshold, comparison) before you draw anything.
- Review weekly and remove one tile a quarter. A dashboard that only grows becomes the wall it was meant to replace.
Common mistakes on metrics dashboards
- Everything on one level. Thirty equal tiles give no priority; use three layers.
- A north star that can rise while revenue falls. Pageviews are the classic example.
- Inputs without a formula. If the inputs do not multiply or add to the north star, the dashboard cannot explain a change.
- Guardrails without thresholds. In the example, the 1.4% error rate is only alarming because you decided in advance that 0.6% is normal.
- Different comparison periods per tile. A tile compared with last week next to one compared with last year cannot be read together.
- No owners. A number nobody is responsible for will not move.
How do you build a three-layer metrics dashboard in TapCub?
Here is the store above, set up in TapCub. TapCub shows what it collects (traffic, events, errors and performance); numbers such as refunds stay in your own system.
- Define the metrics. In All-platform analytics › Behavior › Metrics & SQL, save each input as a metric: a built-in measure, an event with an aggregation (total, uniques, average per subject, property sum and more), or a formula such as buyers over active people. The editor previews the last 28 days before you save.
- Build the board. Save analyses from the builder, then place them as cards on a dashboard under All-platform analytics › Overview › My dashboards. A card is a saved analysis, a text block or a divider, so you can put the north star in a large card, inputs below and a text block with the thresholds. The board has its own date, filters and comparison, and can be the default or be pinned into the web shell.
- Add guardrails. The error rate is on Monitoring › Errors (errors ÷ pageviews, with affected visitors and sessions) and real-user speed on Monitoring › Performance (Core Web Vitals).
- Turn thresholds into alerts. In All-platform analytics › Operations › Monitors, choose
error_rate,bounce_rateor a saved metric, set a condition, and use the dry run to see how many times the last 30 days would have fired. Monitors only notify; they do not change anything. - Annotate. Mark the promotion and the release in Configuration › Annotations so the trend carries its own explanation.
TapCub does not choose your north star or set your thresholds; those are decisions the owners make. It supplies the numbers and the alerts.
FAQ
What is a metrics dashboard?
A metrics dashboard is a single screen that shows the measures a team manages by, over time and against a comparison period. The version that works arranges them in three layers: one north star, a few input metrics that explain it, and guardrails that must not get worse.
What is the difference between a metrics dashboard and a KPI dashboard?
The two overlap. A KPI dashboard tracks a chosen set of performance indicators against targets, while a metrics dashboard can show any measures, including diagnostics. The three-layer arrangement fits either, because it separates the headline number from the levers and the safety checks.
How many metrics should a dashboard have?
Eight to ten on the first screen: one north star, three to five inputs and two to four guardrails. Put detail behind a click, such as a metric tree for any input. If a number never changes a decision, remove it.
What are guardrail metrics?
Guardrail metrics are numbers that must not get worse while you improve the main ones, such as error rate, page speed, refund rate or bounce rate. Each should have a threshold set in advance so that a breach triggers a review rather than a debate.
How often should a metrics dashboard be reviewed?
Review the north star and inputs weekly with the owners. Guardrails should alert you as they happen and be reviewed with the weekly numbers. Remove one tile a quarter so the board does not grow back into a wall of numbers.
Sources
- Google. Web Vitals — Largest Contentful Paint thresholds, with 2.5 seconds or less as good, measured at the 75th percentile. Verified 2026-11-19.
- Google. Monitoring Distributed Systems, Site Reliability Engineering — watching the few signals that show users are being hurt. Verified 2026-11-19.
Was this article helpful?
We use your answers to fix and expand this page.
Couldn’t send. Please try again in a minute.
Thanks for the feedback. We’ll use it to improve this page.You’ve already sent feedback on this page. Thanks.

Product Experience Specialist
Writes about product experience, practical workflows, and growth, turning complex processes into clear steps for everyday decisions.