Try it on your own data
Every report in this article is in the free plan. One snippet for web and apps, up to 10 sites.
Start freeA cohort is a group of people who share the same starting point, usually something they all did in the same period, such as signing up in the same week. You follow that fixed group over time instead of averaging everyone together, so new and old users are not mixed. Knowing how to build and read one matters more than reciting the definition: below are the two main kinds, three steps to define one and a retention table recomputed by hand.
What you will learn
- A cohort is defined by a starting event and a period, and its membership is closed once the period ends
- Write down three things: starting event, grouping period and return event, or two reports will not match
- In a retention table an unfinished period is blank, not zero; treating it as zero turned 13.9% into 8.3% in the example
What is a cohort, exactly?
A cohort is a group of people who share a defining trait or experience, usually something that happened to all of them in the same period: born in the same year, enrolled in the same semester, signed up in the same week. Statisticians use the word this way: following one cohort over time shows how that group changes, whereas a "period" view takes a snapshot of every group at one moment.
In product and marketing analytics the meaning is the same, with one practical addition: the shared trait is something your tracking can compute. Google Analytics 4, for example, defines a cohort as a group of users who share a trait set by a dimension, and its cohort exploration offers inclusion criteria such as the first visit, any event, any transaction or a specific event, grouped by day, week or month. So when someone says "the January cohort", they mean "everyone who did X for the first time in January", and everything you then measure is about that fixed set of people.
That fixed membership is the whole point. A report that says "30% of active users came back" mixes people who joined yesterday with people who joined a year ago. A cohort report keeps the starting line the same for everyone in the group, so a difference between two cohorts is a difference you can start to explain. If you want the definition page, see the cohort glossary entry; this article is about building and reading one. For the full analysis workflow, including how to act on the result, see how to do cohort analysis.
The two kinds of cohort: time and behavior
Almost every cohort you will meet is one of two kinds. The difference is what puts a person in the group.
| Kind | Joined the group by | Example | Question it answers |
|---|---|---|---|
| Time (acquisition) cohort | When they first did something | Everyone who signed up in the week of Jan 5 | Are newer users sticking better than older ones? |
| Behavior cohort | What they did, in any period | Everyone who used export 3 or more times in 30 days | Do people who do X behave differently afterwards? |
| Property cohort | An attribute they have | Everyone on the annual plan | Does this kind of customer behave differently? |
A time cohort is the default for retention work, because the starting line is a date and every member has the same amount of time to come back. A behavior cohort is closer to a behavioral cohort: its membership depends on an action rather than a date, so people join at different times and you usually pair it with a rolling window ("in the last 30 days"). A property cohort is the weakest of the three for prediction, because attributes say who someone is and not what they did, but it is useful for checking whether a change helped one customer type more than another.
Two cautions apply to all three. First, a cohort is not the same as a segment that refreshes daily: a segment gains and loses members every day, while a time cohort's membership is closed once the period ends. Second, the more specific the cohort, the smaller it gets. A cohort of 40 people tells you very little, and later sections show why.
| Kind | Joined the group by | Example | Question it answers |
|---|---|---|---|
| Time (acquisition) cohort | When they first did something | Signed up in the week of Jan 5 | Are newer users sticking better than older ones? |
| Behavior cohort | What they did, in any period | Used export 3 or more times in 30 days | Do people who do X behave differently afterwards? |
| Property cohort | An attribute they have | On the annual plan | Does this kind of customer behave differently? |
Time cohorts are the default for retention; behavior cohorts need a rolling window.
Why use cohorts instead of one overall number?
Because overall numbers hide changes that happen to new users. Imagine a product that improves onboarding in the third week of a quarter. Overall retention moves slowly, because most users joined before the change and are unaffected. The cohort that signed up after the change shows the difference immediately, while the earlier cohorts stay as they were.
Three situations where a cohort view answers a question the overall number cannot:
- Did a change help new users? Compare the cohort before the change with the cohort after it, using the same retention period for both.
- Is growth masking churn? If signups double every month, total active users can rise while each new cohort retains worse than the last. Reading across cohorts for week 1, week 2 and week 4 shows it.
- Which channel brings people who stay? Build one cohort per acquisition source and compare their week-4 retention instead of their signup counts.
The next sections build one cohort, then read a small table with real arithmetic.
How to build a cohort in three steps
- Choose the starting event. This is the thing that puts someone in a cohort: first visit, signup, first purchase, first use of a feature. Pick an event that is specific and happens once per person. "Signed up" works; "was active" does not, because it happens repeatedly and a person would never have a clear starting line.
- Choose the period that groups them. Day, week or month. Use weeks for products people use a few times a week, days for apps used daily and months for subscriptions that renew monthly. The period decides how many people land in each cohort, so with small volumes choose the longer period. Note the calendar: GA4's weekly cohorts run Sunday to Saturday, while a calendar week can also start on Monday, or a cohort can use a rolling seven days from each person's first moment. Those give slightly different cohorts, so keep the same convention when you compare.
- Choose the return event and the periods to measure. "Came back" can mean any activity or one specific action, such as placing a second order. Then decide which periods to read: day 1, 7 and 30 for an app; week 1, 2 and 4 for most web products. Write the definition down, because a number like "week 2 retention" is meaningless without it.
If you cannot write the three choices in one sentence, the cohort is not defined yet. For example: "People who signed up in a calendar week, counted as retained in week N if they did anything on the site in that week." That sentence is what you compare against next month.
A worked example: three signup cohorts
Sample data: a small product tracks every signup, grouped by calendar week, and measures how many of them return in later weeks. Week 0 is the signup week. A person counts as retained in week N if they have any activity in that week, so the retention rate is returned people divided by cohort size.
| Signup cohort | Size (week 0) | Week 1 | Week 2 | Week 4 |
|---|---|---|---|---|
| Week of Jan 5 | 400 | 140 (35.0%) | 100 (25.0%) | 60 (15.0%) |
| Week of Jan 12 | 500 | 190 (38.0%) | 120 (24.0%) | 65 (13.0%) |
| Week of Jan 19 | 600 | 270 (45.0%) | 150 (25.0%) | not yet (empty) |
Every rate is returned ÷ size: 140 ÷ 400 = 35.0%, 190 ÷ 500 = 38.0%, 270 ÷ 600 = 45.0% for week 1; 100 ÷ 400 = 25.0%, 120 ÷ 500 = 24.0%, 150 ÷ 600 = 25.0% for week 2; 60 ÷ 400 = 15.0% and 65 ÷ 500 = 13.0% for week 4. The third cohort's week 4 is blank because that week has not finished when the table is read. It is not zero.
To get a single figure for the whole table you weight by cohort size. Week 1 across all three cohorts: (140 + 190 + 270) ÷ (400 + 500 + 600) = 600 ÷ 1,500 = 40.0%. Week 2: (100 + 120 + 150) ÷ 1,500 = 370 ÷ 1,500 = 24.7%. Week 4 can only use the cohorts that have reached it: (60 + 65) ÷ (400 + 500) = 125 ÷ 900 = 13.9%.
The easy mistake is to put the blank cell in as zero. Then week 4 would be (60 + 65 + 0) ÷ 1,500 = 8.3%, which makes retention look 5.6 percentage points worse than it is, purely because the newest cohort is still too young.
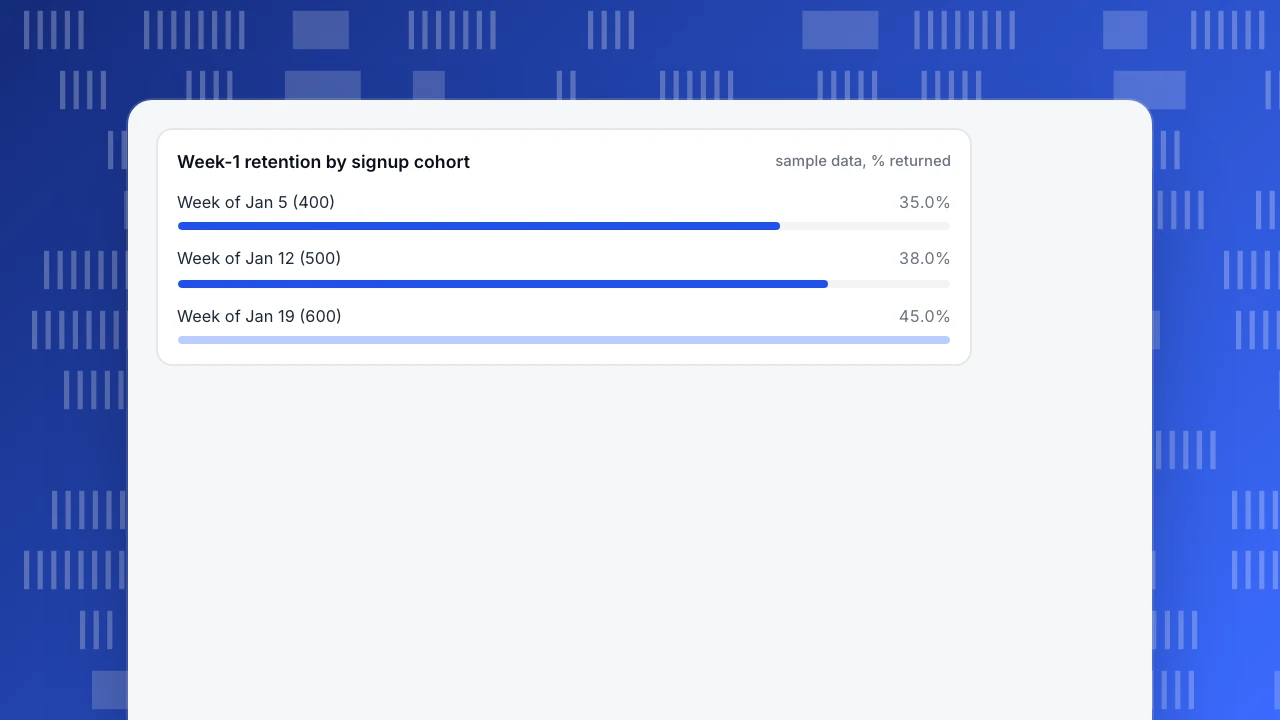
Week-1 retention by signup cohort
sample data, % returnedHow to read a cohort table
Read a table like the one above in three directions.
Along a row to see one cohort's decay. The Jan 5 row goes 35.0% → 25.0% → 15.0%: the biggest loss is in the first week, and later weeks lose less. That shape, steep at first and then flattening, is what a retention curve shows. If a row never flattens, the product has no stable core of returning users yet.
Down a column to compare cohorts at the same age. In week 1 the three cohorts read 35.0%, 38.0% and 45.0%, an apparent improvement. In week 2 they read 25.0%, 24.0% and 25.0%. So the Jan 19 cohort came back more in week 1 and then fell to the same level as the others by week 2. Possible explanations include a prompt that brought people back once, such as a welcome email, without changing whether they found lasting value. The table does not tell you which; it tells you where to look. That is the main job of a cohort table: it turns a vague "retention improved" into "week 1 improved, week 2 did not".
Along the diagonal to see calendar effects. All cells in the same calendar week sit on a diagonal. If every cohort dips in the same calendar week, the cause is probably the calendar (a holiday, an outage, a pricing change), not the cohorts themselves.
Before trusting a difference, check two things. The size of the cohort: 25.0% of 400 people is 100 people, and a swing of 10 people is 2.5 percentage points, so small gaps between small cohorts are noise. And the unit: week 4 means the fourth week after signup, not the fourth week of the year.
For benchmarks and how the numbers connect to other measures, see retention metrics.
Common mistakes with cohorts
- Treating empty periods as zero. In the example it turns 13.9% into 8.3%. Leave unfinished periods blank, and leave them out of any average.
- Defining the start as "active". If anyone active in the period can be a member, the cohort is the same as the overall population. Pick a one-time event.
- Comparing cohorts of different ages. Week 4 of one cohort and week 1 of another are different questions. Compare columns, not diagonals, unless you are looking for calendar effects.
- Reading small cohorts as trends. A cohort of a few dozen people can swing 10 points on a single person's behavior.
- Changing the definition between reports. Moving from Sunday-start weeks to Monday-start weeks, or from "any activity" to "a purchase", changes the cohort. Keep a written definition next to the table.
- Using one cohort type for every question. Time cohorts answer "is the product getting better for new users?"; behavior cohorts answer "what do people who do X do next?". Using the wrong one produces a table that looks fine and answers the wrong question.
How to build and read a cohort in TapCub
Here is how the three-cohort table above would be set up in TapCub. TapCub produces the table and the per-cohort rates; the decision about what to change is yours.
- Open the retention measurement. In All-platform analytics › Behavior › Behavior analysis, pick retention. Choose an optional start event (for example signup) and an optional return event; with both off, any activity counts. Choose the period (day, week or month) and how many periods to show; the range is up to 30 days or 12 weeks or months, with 14 days as the default.
- Choose how the cohorts line up. Alignment defaults to each person's own first moment, which treats a week as 7 days from that point; the alternative is calendar weeks or months. Pick one and keep it. By default only people whose first start event in history falls in the cohort are included.
- Read the table. Each row is a cohort with its start date, size, and a count plus a rate for each period. A period that has not ended yet is empty, not zero, which is the behavior the example above needed, and the line under the table is the size-weighted average rate. Period 0 is the start itself, so rates begin at period 1.
- Build a behavior cohort. In All-platform analytics › Users › Segments & tags, write a rule segment such as "did export 3 or more times in the last 30 days". Use Analyze to apply the segment as a cohort in an analysis, so the same definition is reused instead of rebuilt per chart.
- Know the limits. Anonymous visitors have no profile, so a person-based behavior cohort only includes people who have logged in. TapCub does not run experiments or change your onboarding; it measures who came back. If the table suggests a fix, make it elsewhere and read the next cohort.
FAQ
What is a cohort in simple terms?
A cohort is a group of people who share the same starting point, such as everyone who signed up in the same week. Following that group over time shows how it changes, without newer or older people mixed in.
What is the difference between a cohort and a segment?
A cohort is defined by a shared starting event in a period and its membership is fixed once that period ends. A segment is a rule that is recomputed, for example "active in the last 30 days", so people enter and leave it. You can use a segment as a cohort by applying it to an analysis.
What are examples of cohorts?
Users who signed up in the week of Jan 5; customers who made a first purchase in March; accounts that adopted a feature in their first 14 days; visitors who arrived from one campaign in a given month. Each has a clear starting event, and everything measured afterward refers to those same people.
What does "define cohort" mean in analytics?
It means writing down three things: the starting event that puts someone in the group, the period that groups them (day, week or month), and the return event that counts as coming back. Without all three, two analysts can read the same table and mean different things.
How big should a cohort be?
Large enough that one person's behavior does not move the rate noticeably. With 400 people, ten people are 2.5 percentage points; with 40 people, they are 25 points. If your cohorts are small, group by month instead of week, or compare averages across several cohorts.
Sources
- Wikipedia. Cohort (statistics) — a cohort as a group sharing a defining trait, and the contrast with period data. Verified 2026-11-18.
- Google Analytics Help. [[GA4] Cohort exploration](https://support.google.com/analytics/answer/9670133) — cohort inclusion criteria and daily, weekly and monthly granularity. Verified 2026-11-18.
Was this article helpful?
We use your answers to fix and expand this page.
Couldn’t send. Please try again in a minute.
Thanks for the feedback. We’ll use it to improve this page.You’ve already sent feedback on this page. Thanks.

Customer Experience Consultant
Writes about live chat, visitor conversations, and self-service, sharing practical ways to make customer communication clearer and more effective.