Try it on your own data
Every report in this article is in the free plan. One snippet for web and apps, up to 10 sites.
Start freeProduct metrics are measures of what users do in your product and what that is worth, best grouped by stage: acquisition (visit-to-signup rate), activation (users who do the key action ÷ signups), retention (week-4 retention, DAU ÷ MAU, churn) and revenue (paid conversion, ARPU, LTV). Below: each formula, one sample cohort carried from visit to payment, and rules for how many to track.
What you will learn
- Group metrics by stage and keep one headline number per group
- Define every metric with its denominator and time window, such as activation within 7 days
- Follow one cohort from visit to payment: the stage to fix is the one with the largest gain per unit of effort
What counts as a product metric
A product metric is a number that describes what people do in your product and what that behaviour is worth: how many arrive, how many reach the first useful moment, how many come back, how much they pay. It differs from a general business metric (revenue, headcount, cash) because you can trace it to a user action and change it by changing the product.
The most durable way to organise them is by the stage of the user's path, the AARRR layout that Dave McClure presented in his "Startup Metrics for Pirates" slides: acquisition, activation, retention, referral and revenue. This guide uses four groups (referral is rare enough in most products to fold into acquisition) and gives each metric a formula you can check against your own data. For how these roll up into a recurring-revenue business, see SaaS metrics; for laying them out on a screen, see product analytics dashboard; for which stage to fix first, see AARRR: the first lever.
The metrics at a glance
The table uses one sample month, explained in full in the worked example below (Sample data).
| Group | Metric | Formula | Sample value |
|---|---|---|---|
| Acquisition | Visit-to-signup rate | signups ÷ visitors | 1,600 ÷ 40,000 = 4.0% |
| Acquisition | Cost per signup | spend ÷ signups | $24,000 ÷ 1,600 = $15.00 |
| Activation | Activation rate | users who did the key action in 7 days ÷ signups | 672 ÷ 1,600 = 42.0% |
| Retention | Week-4 retention | activated users active in week 4 ÷ activated users | 302 ÷ 672 = 44.9% |
| Retention | Stickiness (DAU ÷ MAU) | daily active ÷ monthly active | 3,100 ÷ 12,400 = 25.0% |
| Retention | Monthly churn | paying users lost ÷ paying users at start | 3.5% |
| Revenue | Paid conversion | paying users ÷ signups | 96 ÷ 1,600 = 6.0% |
| Revenue | ARPU (per paying user) | revenue ÷ paying users | $29.00 a month |
| Revenue | Lifetime value (LTV) | ARPU × gross margin ÷ churn | $29 × 0.80 ÷ 0.035 = $662.86 |
| Decision | Rule | Why |
|---|---|---|
| Which metrics to show | One headline per group, four in total | A dashboard of 30 numbers is read by nobody |
| Which action defines activation | Earliest action most retained users did and most churned users did not | Predicts staying, not just signing up |
| How to compare periods | Same window, same denominator, monthly cohorts | Blended totals hide a worsening stage |
| When to read a cohort | After a few hundred users | One person moves a 30-user cohort by several points |
| How to use LTV | Compare channels, do not forecast | Assumes churn stays constant |
If nobody would act when a metric moves, drop it from the main view.
Acquisition: are the right people arriving?
Acquisition metrics count and price the arrivals. Three are enough to start.
- Visitors and sessions by source. Not a quality measure on its own; its job is to show where arrivals come from, using the source and UTM data your analytics collects (see UTM).
- Visit-to-signup rate = signups ÷ visitors. In the sample, 1,600 ÷ 40,000 = 4.0%. Track it by source, not as one blended number: a channel that sends 10,000 visitors at 0.5% hurts the blend even if the other channels are healthy.
- Cost per signup = spend ÷ signups. In the sample, $24,000 ÷ 1,600 = $15.00. Cost per signup is only useful next to what those signups later do. A channel at $10 per signup that never activates costs more per useful user than one at $25 that does.
Count people, not machines. If crawler and AI-bot requests are mixed into visitors, the denominator of every rate above is inflated and the rates look worse than they are.
Activation: did they reach the first useful moment?
Activation is the share of new users who do the one thing that predicts they will stay, within a fixed time. The hard part is picking the action. Rule: choose the earliest action that (a) most retained users did and (b) most churned users did not, and write it down as an event with a time limit.
Activation rate = users who did the key action within N days ÷ users who signed up. In the sample, 672 of 1,600 signups created a first project within 7 days: 42.0%. See activation rate.
Two checks keep the metric honest:
- Fix the window. "Ever activated" rises without limit and hides slow onboarding. "Within 7 days" can be compared across months.
- Look at time to activate as well as the rate. If the median is 5 days and the window is 7, a small slowdown will look like a collapse in the rate.
Retention and engagement: do they come back?
Retention metrics ask whether activated users keep using the product.
- Week-4 retention = activated users active in week 4 ÷ activated users. In the sample, 302 ÷ 672 = 44.9%. Plot it for every weekly cohort as a retention curve. A curve that flattens means some users have formed a habit; a curve that falls to zero means none have. See retention.
- Stickiness (DAU ÷ MAU) = daily active users ÷ monthly active users. With 3,100 daily and 12,400 monthly users, stickiness is 25.0%, meaning the average monthly user shows up on roughly 7.5 days in a 30-day month (0.25 × 30). Google's analytics help defines active users through engaged sessions and reports 1-, 7- and 30-day active-user counts; whatever tool you use, write the activity definition down. See DAU and MAU.
- Monthly churn = paying users lost in the month ÷ paying users at the start of the month. At 3.5% the expected lifetime of a paying user is 1 ÷ 0.035 = 28.6 months. See churn.
Pick the activity definition carefully: "opened the app" and "did the core action" give very different stickiness numbers for the same users.
Revenue: what is a user worth?
Revenue metrics turn behaviour into money.
- Paid conversion = paying users ÷ signups. In the sample, 96 ÷ 1,600 = 6.0%.
- ARPU = revenue ÷ users. Define the denominator (all users or paying users) and keep it fixed: $29.00 per paying user per month here. See ARPU.
- LTV = ARPU × gross margin ÷ churn. With 80% margin: $29 × 0.80 = $23.20 of margin a month, ÷ 0.035 = $662.86.
- CAC (customer acquisition cost) = acquisition spend ÷ new paying customers. $24,000 ÷ 96 = $250.
- LTV : CAC = 662.86 ÷ 250 = 2.65, and payback = CAC ÷ monthly margin = 250 ÷ 23.20 = 10.8 months.
LTV from a single churn rate is a rough guide: it assumes churn stays constant and ignores that early months usually churn faster. Use it to compare channels, not to promise a number.
Worked example: one signup cohort from visit to payment
Sample data: one month, one product, 40,000 visitors, $24,000 in acquisition spend.
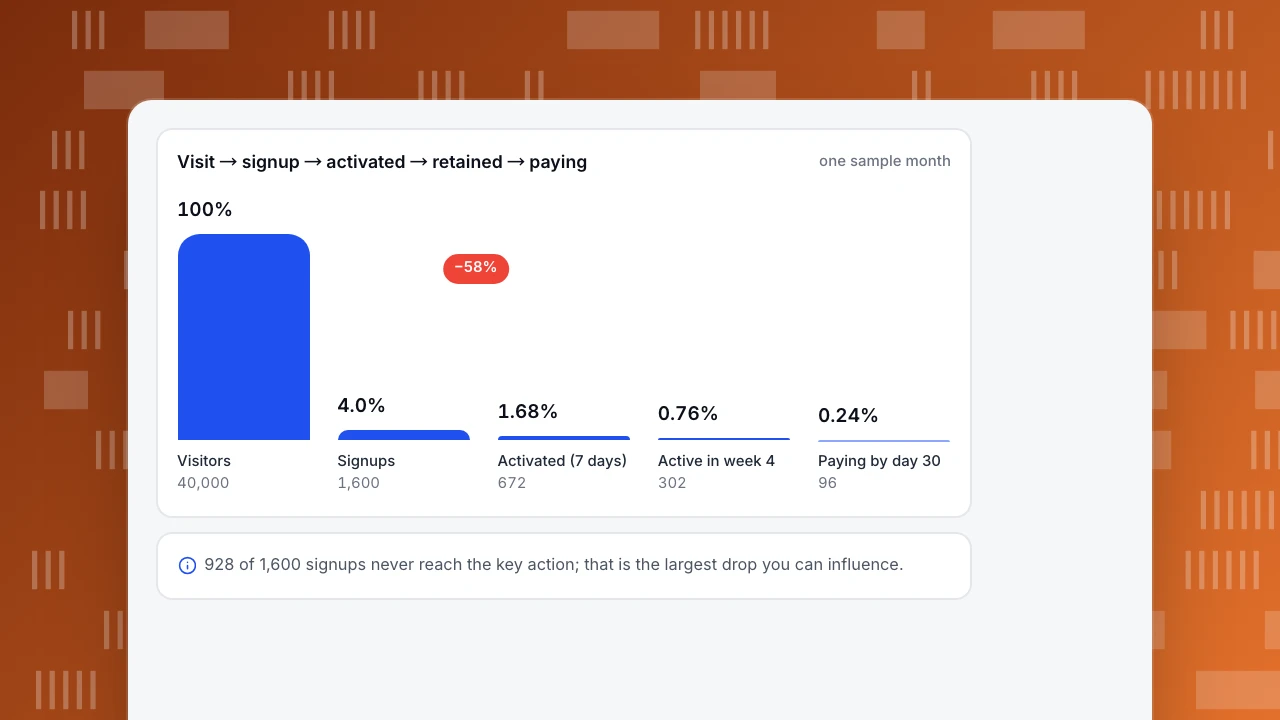
- 1,600 visitors sign up: 4.0%.
- 672 of them do the key action within 7 days: 42.0% activation; 58.0% (928 people) do not.
- 302 of the 672 are active in week 4: 44.9%.
- 96 users are paying by day 30: 6.0% of signups.
Read it from the end. The biggest drop that you can influence is between signup and activation, where 928 people leave. Lifting activation from 42.0% to 50.0% adds 128 activated users (800 − 672). If retention and paid conversion stay at their current rates, that is 800 × 44.9% = about 359 retained users instead of 302. Raising visit-to-signup from 4.0% to 5.0% would add 400 signups, but at an activation rate of 42.0% only 168 of them would activate. The stage to fix first is the one with the largest improvement per unit of effort, not the one with the smallest percentage.
Visit → signup → activated → retained → paying
one sample monthVisitors
40,000
Signups
1,600
Activated (7 days)
672
Active in week 4
302
Paying by day 30
96
How many metrics should you track?
Use these rules.
- One headline per group, four in total. A dashboard of 30 numbers is read by nobody. Pick one acquisition, one activation, one retention and one revenue metric, and keep the rest in drill-downs.
- Every metric gets an owner and a decision. If the number moves and nobody would act, drop it.
- Pair a volume with a rate. Signups alone rise when you spend more; the rate shows whether quality held.
- Check the denominator and the window. "Users" must mean the same people in every formula; windows (7 days, 30 days) must be written next to the name.
- Review monthly cohorts, not blended totals. Averaging old and new cohorts hides a deteriorating onboarding for months.
Common mistakes with product metrics
- Vanity totals. Cumulative signups only go up. Use rates and cohorts.
- Blended rates. A 4.0% overall visit-to-signup rate can hide one channel at 0.5%.
- Changing definitions silently. If "active" changes from "opened" to "did the core action", mark the date on the chart; otherwise the break reads as a trend.
- Treating LTV as a forecast. It is a model with a constant churn assumption.
- Counting bots. Automated traffic raises visitors and lowers every rate.
- Small cohorts. A cohort of 30 signups moves several points on one person; wait for a few hundred before reading changes.
Tracking these metrics in TapCub
Take the sample month. You have 1,600 signups, a 42.0% activation rate and a suspicion that onboarding is the weak stage.
- Record the events. On the website, call
tapcub.track('signup')andtapcub.track('project_created'); revenue goes in apurchaseevent with arevenueproperty. The same code covers web, app and mini-program data. - Build the funnel. In All-platform analytics › Behavior › Behavior analysis, make a funnel from the signup event to the key action with a 7-day window. It shows count, rate versus step one and versus the previous step, drop-off and median time between steps; the largest drop is marked.
- Read retention. The same page has retention for a group of users: who comes back in week 1, 2, 3, 4. All-platform analytics › Business › AARRR growth lays the stages out in the same acquisition-to-revenue order as this article.
- Define your own metric. In All-platform analytics › Behavior › Metrics & SQL, define a metric as an event plus an aggregation (for example distinct users who did the key action), or a formula over two of them, and reuse it.
- Know the boundary. Money metrics such as LTV, CAC and churn come from your own billing and spend data; TapCub does not handle payments or billing. Channel spend can be imported in Channel ROI, which then shows cost per click and per acquisition by channel.
FAQ
What are product metrics?
Product metrics are measures of what users do in a product and what that is worth: acquisition (how many arrive), activation (how many reach a first useful action), retention (how many return) and revenue (how much they pay). Each has a formula, for example activation rate = users who did the key action ÷ signups.
What are examples of product metrics?
Visit-to-signup rate, activation rate, week-4 retention, DAU ÷ MAU stickiness, monthly churn, paid conversion, ARPU and LTV. In the sample here they were 4.0%, 42.0%, 44.9%, 25.0%, 3.5%, 6.0%, $29.00 a month and $662.86.
How many product metrics should I track?
One headline metric for each of the four groups, with the rest as drill-downs. If nobody would take a different action when a number moves, remove it from the main view.
What is the difference between product metrics and business metrics?
Product metrics trace to user behaviour and can be moved by changing the product (activation rate, retention). Business metrics describe the company as a whole (revenue, cash, headcount) and are affected by many things beyond the product. Revenue and LTV sit on the boundary.
What is a good retention rate?
There is no universal number; it depends on how often the product is naturally used. Compare each cohort with your own earlier cohorts, and look at the shape of the curve: a curve that flattens means a group of users has formed a habit.
Sources
- Dave McClure. Startup Metrics for Pirates. Slides, 2007 talk, March 2009 version: acquisition, activation, retention, referral and revenue. Checked 2026-11-21 via search listing.
- Google Analytics Help. [[GA4] Understand user metrics](https://support.google.com/analytics/answer/12253918). Active users, engaged sessions and 1-, 7- and 30-day active-user counts. Checked 2026-11-21.
- Google Analytics Help. [[GA4] Engagement rate and bounce rate](https://support.google.com/analytics/answer/12195621). Engaged session: longer than 10 seconds, a key event, or at least two page views. Checked 2026-11-21.
Was this article helpful?
We use your answers to fix and expand this page.
Couldn’t send. Please try again in a minute.
Thanks for the feedback. We’ll use it to improve this page.You’ve already sent feedback on this page. Thanks.

Technical Engineer
Focuses on tracking code, SDKs, and API integrations, with practical guidance on implementation checks and troubleshooting.