Try it on your own data
Every report in this article is in the free plan. One snippet for web and apps, up to 10 sites.
Start freeTo choose product adoption software, decide whether you need measurement or in-app guidance first, then test each candidate on one adoption rate you computed yourself and score six criteria with weights set before the demos. The same scores give a different winner for a measurement-first team and a guidance-first team.
What you will learn
- Three kinds of tool: analytics for adoption, in-app guidance and suites; decide the job before comparing features
- Any tool must reproduce one number you verify by hand: accounts who used the feature N times in the window ÷ eligible accounts (26.0% in the sample)
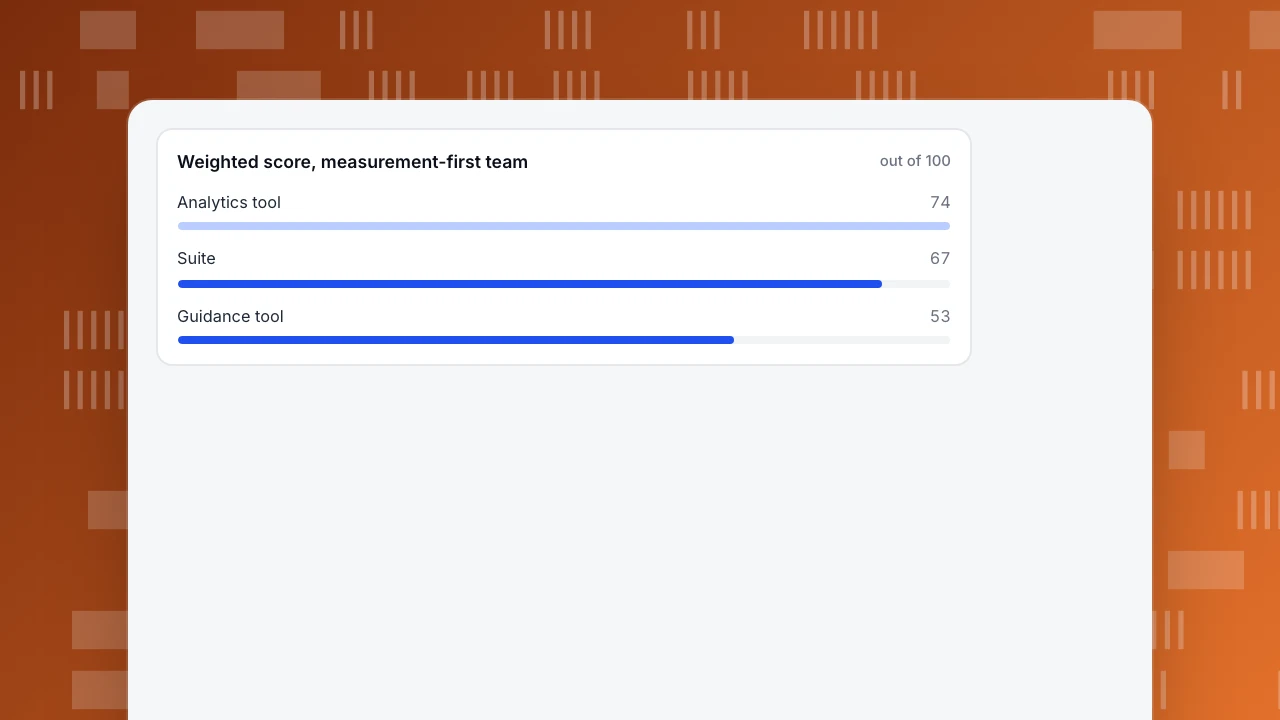
- Write weights before demos: the same scores give 74 vs 53 vs 67 for a measurement-first team and 51 vs 70 vs 68 for a guidance-first team
Three kinds of product adoption software
"Product adoption software" is sold as one category but covers three different jobs, and most buying mistakes come from mixing them up.
| Kind | Main job | What it usually includes | What it usually lacks |
|---|---|---|---|
| Analytics for adoption | Show who uses which feature | Events, funnels, retention, segments | Anything shown inside your app |
| In-app guidance | Show messages, tours and checklists to users | Tours, tooltips, checklists, targeting rules | Deep analysis outside its own campaigns |
| Suite | Both, in one product | A bit of each | The depth of a specialist in either |
Decide which job you are hiring for before you compare features. If you cannot say today what share of your accounts use the feature you launched last quarter, you need measurement first; guidance without measurement only shows you messages you cannot evaluate. If you already measure well and the numbers show people stalling at the same step, guidance is the next purchase.
This article is about choosing the software. For how to calculate adoption, see how to measure product adoption, and for what to do once you have the number, how to increase product adoption.
The adoption rate any tool must reproduce
Whatever you buy has to produce one number you can verify by hand. Use this:
Feature adoption rate = accounts (or users) who used the feature at least N times in the window ÷ accounts (or users) eligible to use it
Choose N and the window before you look: for example, three uses in 28 days. Write down who is "eligible", such as accounts on a plan that includes the feature.
Sample data: 1,200 eligible accounts. 312 used the feature at least three times in 28 days.
- Adoption rate = 312 ÷ 1,200 = 26.0%.
- After a guided tour ships, 384 of the same 1,200 accounts qualify in the next 28 days: 384 ÷ 1,200 = 32.0%.
- Relative lift = 384 ÷ 312 − 1 = 23.1%, and the absolute change is 6.0 percentage points.
The arithmetic is simple; the interpretation is not. Without a control group, a rise after a tour can be seasonal or come from a different mix of accounts. Take two precautions: compare against a period with no change, and compare accounts that saw the tour with similar ones that did not. A tool that makes this comparison hard, or that will not let you export the underlying account list, is hiding the denominator.
Six criteria for choosing
Rate each candidate against these, using the question in the right-hand column in a trial.
| Criterion | What to check | Question for the trial |
|---|---|---|
| Measuring adoption | Events, funnels, retention, segments, and the window you can set | Can I reproduce the 26.0% above, with my own definition of "used"? |
| Account level | Does it see accounts as well as individual users? | Can I report adoption per account, not just per user? |
| In-app guidance | Tours, checklists, targeting, and how they affect page speed | Can I show a message to only the accounts that have not used the feature? |
| Export and ownership | Can you get raw events and the account list out? | Can I export the rows behind one chart? |
| Privacy and consent | What is collected before consent, retention, data requests | What is stored by default, and for how long? |
| Setup effort | Who writes the tracking, and how it is kept current | How many hours to measure one feature end to end? |
Two of these hide limits that are easy to miss until they bite.
Event and property limits. Every analytics system has them. As one public example, Google Analytics documents a maximum of 25 parameters per event, parameter names up to 40 characters and values up to 100 characters, and 500 distinctly named events per app user. A plan to send one event with 40 properties describing a feature would hit that ceiling in one product and not in another. Ask for the limits in writing and compare them with your tracking plan.
Accessibility of the guidance. Tooltips and tours put controls on your page. WCAG 2.2, success criterion 2.5.8, requires pointer targets of at least 24 by 24 CSS pixels, with exceptions for spacing and inline links. A tour whose "close" button is 12 pixels wide fails it. Ask whether the product's controls and focus order have been tested, and check one tour with a keyboard.
| Criterion | What to check | Question for the trial |
|---|---|---|
| Measuring adoption | Events, funnels, retention, segments, window | Can I reproduce my own 26.0%? |
| Account level | Accounts as well as users | Can I report adoption per account? |
| In-app guidance | Tours, checklists, targeting, page speed | Can I show a message only to accounts that have not used the feature? |
| Export and ownership | Raw events and account list | Can I export the rows behind one chart? |
| Privacy and consent | Collection before consent, retention | What is stored by default and for how long? |
| Setup effort | Who writes and maintains tracking | How many hours to measure one feature end to end? |
Rate each candidate 0–5 per criterion in a trial, then apply your weights.
Score the types against your own weights
A scored matrix is a way to make the trade-off explicit, not an answer. Sample data: scores from 0 to 5 for each kind of tool against each criterion, and two teams with different weights summing to 100. The scores are illustrative; replace them with your own after trials.
| Criterion | Analytics tool | Guidance tool | Suite | Weights, measurement-first team | Weights, guidance-first team |
|---|---|---|---|---|---|
| Measuring adoption | 5 | 2 | 4 | 30 | 15 |
| Account level | 4 | 2 | 3 | 15 | 10 |
| In-app guidance | 0 | 5 | 4 | 15 | 40 |
| Export and ownership | 4 | 2 | 3 | 15 | 10 |
| Privacy and consent | 4 | 2 | 3 | 15 | 10 |
| Setup effort (5 = easy) | 4 | 4 | 2 | 10 | 15 |
Score = sum of (weight × score) ÷ 5, out of 100.
| Team | Analytics tool | Guidance tool | Suite |
|---|---|---|---|
| Measurement-first | 74 | 53 | 67 |
| Guidance-first | 51 | 70 | 68 |
Same candidates, same scores, a different winner, because the teams want different things. The suite never wins either row because a generalist is rarely the best in a category that the team ranks highest. That is the reason to write the weights down before you watch any demo.
Weighted score, measurement-first team
out of 100The four adoption numbers the software should report
Whatever the tool, check that it reports these four, and that you can see how each is computed.
- Feature adoption rate, as above: eligible accounts that used the feature N times in the window ÷ eligible accounts.
- Time to first use, the median days from signup (or from release) to the first use of the feature. A median is steadier than an average when a few accounts take months.
- Stickiness = daily active users ÷ monthly active users. Sample data: 3,000 daily and 12,000 monthly active users give 3,000 ÷ 12,000 = 25%, meaning the average monthly user is active about one day in four.
- Breadth, the share of accounts using at least three of the five core features. It shows depth that a single-feature rate hides.
A tool that reports only the first, or defines "active" in a way you cannot change, will give you a number you cannot defend.
How to run a one-week trial
- Choose one feature and one definition. For example, "used three times in 28 days".
- Compute the answer yourself. Pull the number from your own database or event export first, so you have a reference.
- Reproduce it in the tool. The numbers should match within the differences you can explain, such as bots or time zones. If they do not, find out why before you go on.
- Break it down by account. Check that the tool can show adoption per account and list the accounts that have not adopted.
- Test the guidance on a small group. Show a tour to part of an eligible group and compare with the rest.
- Export one chart's rows. If you cannot, you do not own the analysis.
Mistakes that cost the most
- Buying guidance before measurement. You will ship tours you cannot evaluate.
- Measuring clicks on the tour instead of use of the feature. Tour completion is not adoption.
- Counting users when you sell to accounts. One champion using a feature is not an account adopting it.
- Skipping the trial reconciliation. A tool that disagrees with your database by 15% will disagree in every meeting.
- Ignoring the load. Anything injected into the page adds script weight; test page speed with and without it.
In TapCub: the measurement half, with a clear boundary
TapCub covers the first kind in the table, analytics for adoption. It does not build in-app tours, checklists or surveys, and it does not run experiments, so if you need guidance you pair it with a separate tool and send that tool's events to TapCub with track() calls to measure the result. For the sample above:
- Define the feature event. In All-platform analytics › Data › Tracking plan, record the event name, properties and platform. The plan is the place where "what counts as use" is written down; turn on real-time validation to see arrivals and completeness of required properties over the last 24 hours.
- Measure the rate. In All-platform analytics › Behavior › Behavior analysis, count distinct people or accounts who did the event, and use a funnel (2 to 20 steps, window up to 180 days) to see where people stall before the feature.
- Group the accounts. After login, call
tapcub.group('company', 'acme', {...}). All-platform analytics › Users › Accounts then shows accounts, 30-day active accounts, members and a 0–100 health score. Account views are organisation views and do not open individual detail. - Build the comparison group. In All-platform analytics › Users › Segments & tags, create a segment of people who did or did not do the event in a window. Segments can be carried into funnels and retention analyses.
- Check retention after adoption. Run retention with the feature event as the start event and see whether adopters come back.
TapCub does not tell you whether a tour caused the lift; use the control group above, and a comparison period, to judge that.
FAQ
What is product adoption software?
It is software that helps you see and raise the share of users or accounts who use a product or feature. It falls into three kinds: analytics that measure adoption, in-app guidance that shows tours and checklists, and suites that do both.
How do I choose product adoption software?
Decide whether you need measurement or guidance first, then score candidates on six criteria: measuring adoption, account level, in-app guidance, export, privacy and setup effort. Weight them before demos, and test by reproducing one adoption number you computed yourself.
What is a good feature adoption rate?
There is no universal benchmark, because it depends on what eligible means and how often the feature is meant to be used. Track your own rate over time and between segments instead. In the sample, 26.0% rose to 32.0% after a change, which needs a control group to interpret.
Do I need in-app guidance to improve adoption?
Not always. If people stall because the feature is hard to find or poorly named, a design change may help more than a tour. Use funnels to find where people stop, then choose the cheapest fix.
Can analytics software replace a digital adoption platform?
It can replace the measurement, not the messages. Analytics shows who has not adopted and where they stall; showing something to them inside the product needs a guidance tool or your own code.
Sources
- Google Analytics Help, Property limits: 25 parameters per event, parameter name length 40, value length 100, 500 distinctly named events per app user. Checked 2026-11-21.
- W3C, Understanding SC 2.5.8: Target Size (Minimum), WCAG 2.2: pointer targets at least 24 by 24 CSS pixels, with exceptions. Checked 2026-11-21.
Was this article helpful?
We use your answers to fix and expand this page.
Couldn’t send. Please try again in a minute.
Thanks for the feedback. We’ll use it to improve this page.You’ve already sent feedback on this page. Thanks.

Product Experience Specialist
Writes about product experience, practical workflows, and growth, turning complex processes into clear steps for everyday decisions.